我想移动边缘标签的位置,使其不在顶部。
这里有一个小例子:
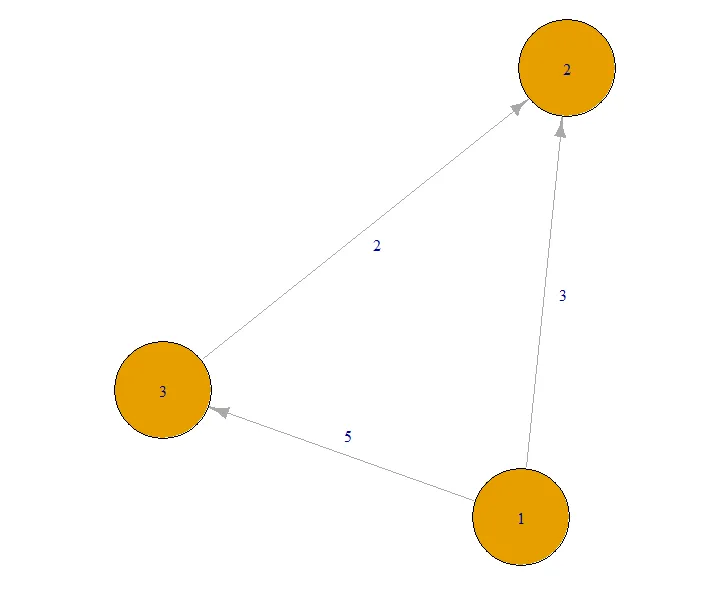
 g <- graph.empty(n=3)
 g <- graph(c(1,2,3,2,1,3), directed=T)
 E(g)$weight <- c(3,2,5)
 plot(g, edge.label = E(g)$weight)
在我的例子中,标签位于边缘上,我希望它们沿着边缘垂直移动一小段距离。
我想移动边缘标签的位置,使其不在顶部。
这里有一个小例子:
g <- graph.empty(n=3)
g <- graph(c(1,2,3,2,1,3), directed=T)
E(g)$weight <- c(3,2,5)
plot(g, edge.label = E(g)$weight)
plot(g, edge.label = c(" 3","2\n","5\n"))
igraph绘图有参数edge.label.x和edge.label.y,用于放置边缘标签,但这些必须在制作图表时使用的坐标中指定。为了获得正确的坐标,您需要自己控制布局。 @GaborCsardi 在他的评论中建议了类似于这样的内容,但实现起来足够复杂,我认为它值得一篇完整的回答。
## Setup - your example graph
library(igraph)
g <- graph.empty(n=3)
g <- graph(c(1,2,3,2,1,3), directed=T)
E(g)$weight <- c(3,2,5)
现在,我们不仅仅是绘制图形,还要捕获顶点的布局以便我们可以使用它。我设置了随机种子以保证可重复性。
set.seed(1234)
LO = layout_nicely(g)
## Start with the centers of the edges (on line)
ELx = rep(0, ecount(g))
ELy = rep(0, ecount(g))
for(i in 1:ecount(g)) {
    ELx[i] = (LO[ends(g,i)[1],1] + LO[ends(g,i)[2],1])/2
    ELy[i] = (LO[ends(g,i)[1],2] + LO[ends(g,i)[2],2])/2 }

## Adjust perpendicular to line
d = 0.03
for(i in 1:ecount(g)) {
    if(abs(LO[ends(g,i)[1],2] - LO[ends(g,i)[2],2]) < 0.1) {
        ## This avoids problems with horizontal edges
        ELy[i] = ELy[i] + shift
    } else {
        S = (LO[ends(g,i)[2],1] - LO[ends(g,i)[1],1]) /
            (LO[ends(g,i)[1],2] - LO[ends(g,i)[2],2])
        shift = d / sqrt(1 + S^2)
        ELx[i] = ELx[i] + shift
        ELy[i] = ELy[i] + S*shift
    }
}
rescale=FALSE。但是igraph仍然希望在范围[-1,1]内绘制,因此我们还必须设置xlim和ylim。plot(g, layout=LO, edge.label = E(g)$weight,
rescale=FALSE, xlim=range(LO[,1]), ylim=range(LO[,2]),
edge.label.x=ELx, edge.label.y=ELy)
调整距离d = 0.03有些随意。我选择它是为了使这个图看起来好看。如果你有一个更复杂的图,你可能需要调整那个距离。
LO [ends (g,i) [1],2]中没有数组的'dimnames'属性。 - DrBwtsdput 命令,这样我就能看到出了什么问题。 - G5Wlibrary(igraph)
library(ggraph)
g <- graph.empty(n=3)
g <- graph(c(1,2,3,2,1,3), directed=T)
E(g)$weight <- c(3,2,5)
#your plot
plot(g, edge.label = E(g)$weight)
#using ggraph
ggraph(graph = g) +
geom_node_circle(size = 1, mapping = aes(r =0.03), fill="goldenrod") +
geom_edge_link(mapping = aes (label = weight),
arrow = arrow(type = "closed", angle = 15),
end_cap = circle(8, 'mm'), ,
start_cap = circle(8, 'mm'),
colour="grey",
label_dodge = unit(5, "mm"),
angle_calc = "along") +
geom_node_text(mapping = aes(label = "2")) +
theme_graph()