简单来说,我想根据相关性强度绘制边缘,删除非显著值。我可以使用
那么,如何将负相关值传递给
edge.betweeness为正相关对绘制边缘,但不幸的是,无法为负相关对执行此操作:data <- matrix(rnorm(100),10,10)
colnames(data) <- LETTERS[1:10]
library(Hmisc)
cor1 <- rcorr(data)
diag(cor1$r) <- 0
library(igraph)
#####Example 1:
graph <- graph.adjacency(cor1$r, weighted=TRUE, mode="lower")
graph <- delete.edges(graph, E(graph)[ weight < 0.3 & weight > -0.3])
#####trying to pass edge weights to edge.width
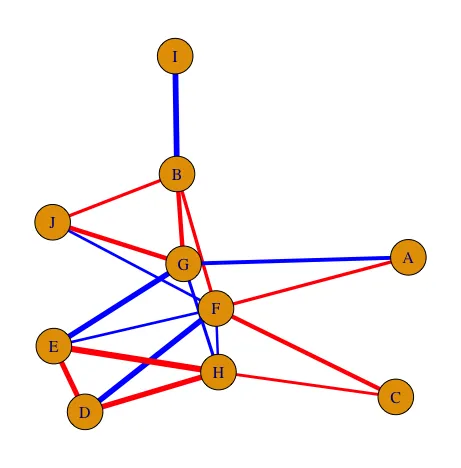
plot.igraph(graph, vertex.size=20, edge.width=E(graph)$weight)
###edge.width=E(graph)$weight is ignored
#####Example 2:
graph <- graph.adjacency(cor1$r, weighted=TRUE, mode="lower")
graph <- delete.edges(graph, E(graph)[ weight < 0.3]) #omitting the 2nd condition
E(graph)$weight <- edge.betweenness(graph) #apparently required
plot.igraph(graph, vertex.size=20, edge.width=E(graph)$weight)
####this does work, but only for positive correlation coefficients
#####Example 3:
graph <- graph.adjacency(cor1$r, weighted=TRUE, mode="lower")
graph <- delete.edges(graph, E(graph)[ weight < 0.3 & weight > -0.3])
E(graph)$weight <- edge.betweenness(graph)
#####gives error: Error in .Call("R_igraph_edge_betweenness", graph, directed, weights, :
#################At centrality.c:2046 : Weight vector must be non-negative, Invalid value
那么,如何将负相关值传递给
edge.width?