我需要将地图坐标转换为像素(以便在HTML中制作可点击的地图)。
这是一个示例地图(使用matplotlib的Basemap软件包制作)。 我在上面放了一些标签,并尝试计算标签的中点像素:
#!/usr/bin/env python
# -*- coding: utf-8 -*-

## Step 0: some points to plot
names = [u"Reykjavík", u"Höfn", u"Húsavík"]
lats = [64.133333, 64.25, 66.05]
lons = [-21.933333, -15.216667, -17.316667]

## Step 1: draw a map using matplotlib/Basemap
from mpl_toolkits.basemap import Basemap
import matplotlib.pyplot as plt

M = Basemap(projection='merc',resolution='c',
            llcrnrlat=63,urcrnrlat=67,
            llcrnrlon=-24,urcrnrlon=-13)

x, y = M(lons, lats) # transform coordinates according to projection
boxes = []
for xa, ya, name in zip(x, y, names):
    box = plt.text(xa, ya, name,
        bbox=dict(facecolor='white', alpha=0.5))
    boxes.append(box)

M.bluemarble() # a bit fuzzy at this resolution...
plt.savefig('test.png', bbox_inches="tight", pad_inches=0.01)

# Step 2: get the coordinates of the textboxes in pixels and calculate the
# midpoints
F = plt.gcf() # get current figure
R = F.canvas.get_renderer()
midpoints = []
for box in boxes:
    bb = box.get_window_extent(renderer=R)
    midpoints.append((int((bb.p0[0] + bb.p1[0]) / 2),
            int((bb.p0[1] + bb.p1[1]) / 2)))
这些计算出的点之间的相对关系大致正确,但与真实点不重合。以下代码片段应该在每个标签的中心放置一个红色圆点:
# Step 3: use PIL to draw dots on top of the labels
from PIL import Image, ImageDraw

im = Image.open("test.png")
draw = ImageDraw.Draw(im)
for x, y in midpoints:
    y = im.size[1] - y # PIL counts rows from top not bottom
    draw.ellipse((x-5, y-5, x+5, y+5), fill="#ff0000")
im.save("test.png", "PNG")
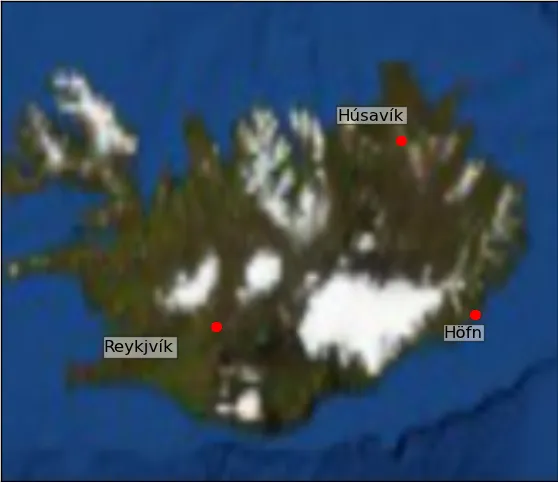
- 红点应该在标签的中间。
我认为错误出现在提取文本框坐标时(步骤#2)。非常感谢任何帮助。
注
- 也许解决方案类似于这个答案?