根据Seaborn API所述,以下代码将生成一个线性回归图。
import numpy as np, pandas as pd; np.random.seed(0)
import seaborn as sns; sns.set(style="white", color_codes=True)
tips = sns.load_dataset("tips")
g = sns.jointplot(x="total_bill", y="tip", data=tips, kind='reg')
sns.plt.show()
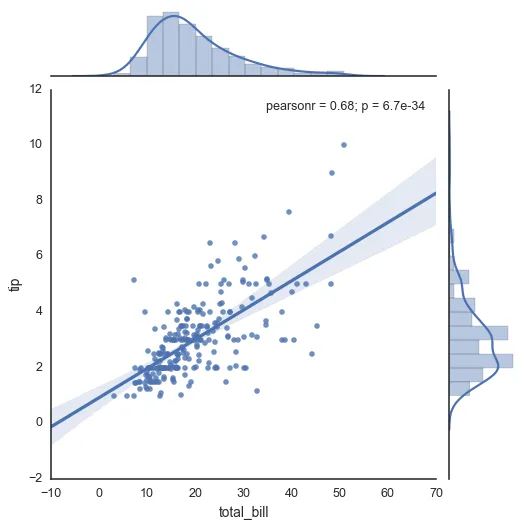
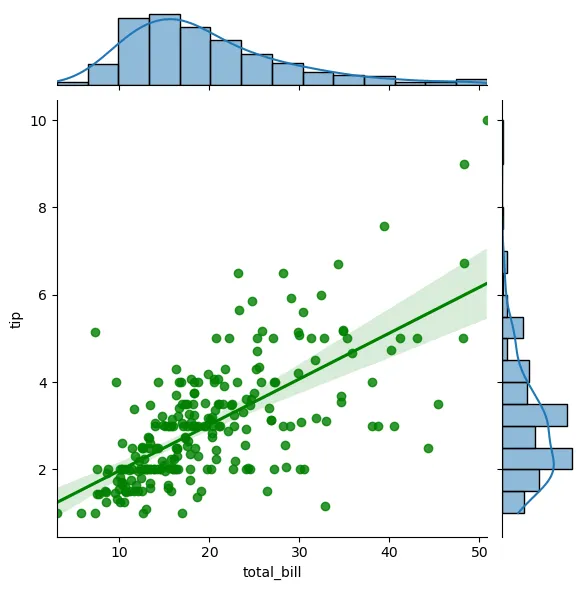
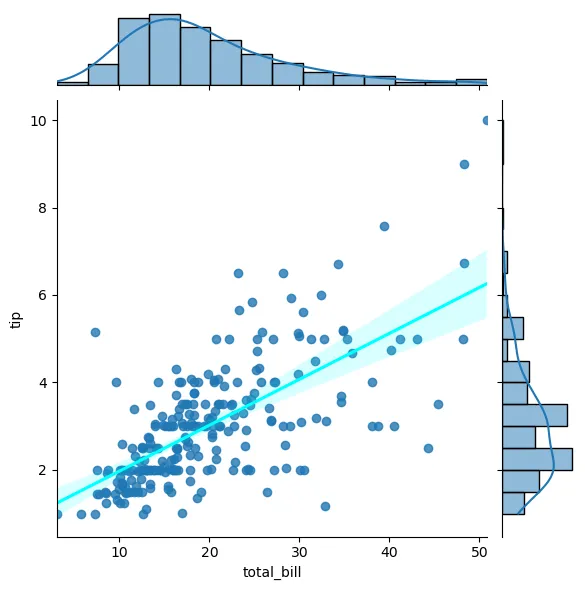
然而,当数据点很多时,回归线就不再清晰可见了。我该如何更改它的颜色?我找不到内置的seaborn命令。
如果线在背景中(即在点的后面),我还想问如何将其移到前面。
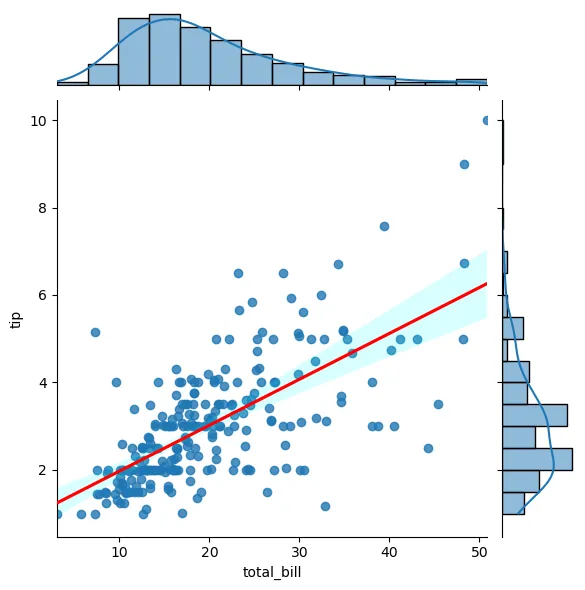
g.lines以尝试猜测回归线中的哪个艺术家,然后执行ln.set_color('k')。 - tacaswellAttributeError: 'JointGrid' object has no attribute 'lines'。 - n1000