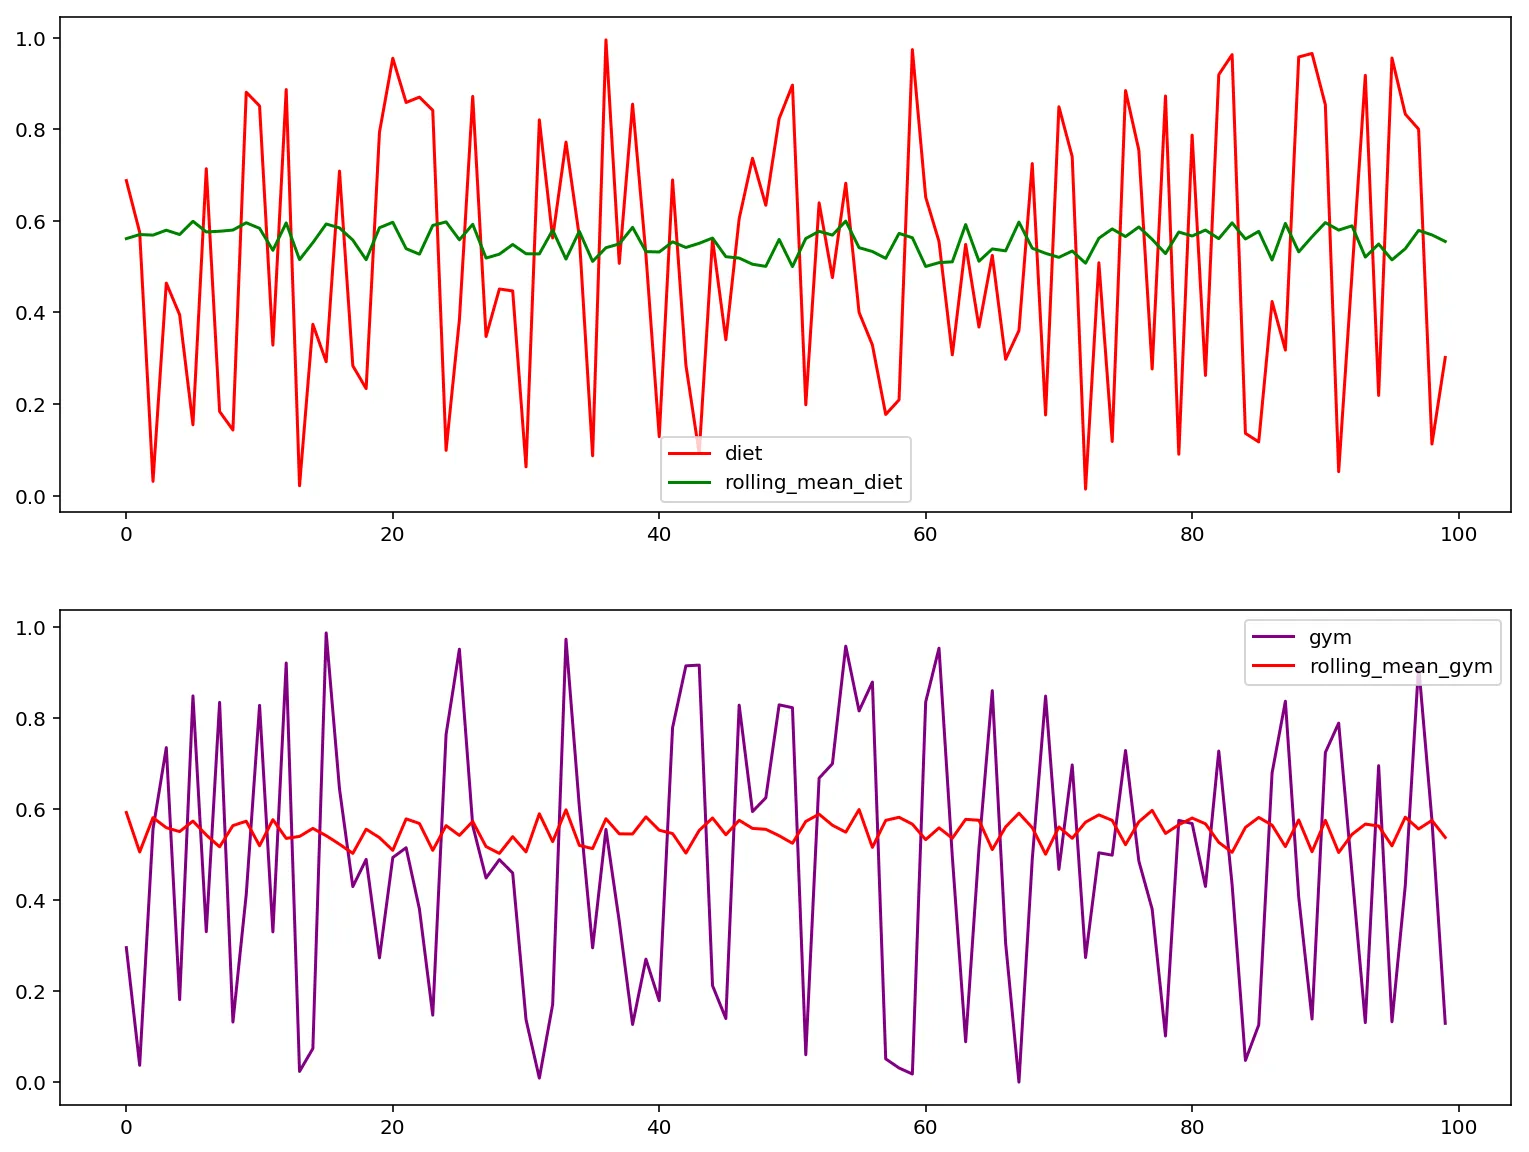
我的目标是为我的数据中的每一列创建一个时间序列图,包括它们对应的滚动平均值。我希望子图中线条的颜色不同。例如,在第二个子图中,gym和rolling_mean_gym的线条颜色应分别为紫色和红色。如何做到这一点?
当我在plot()函数中设置color选项时,它会改变原始数据图和滚动平均图的颜色,这并不理想。
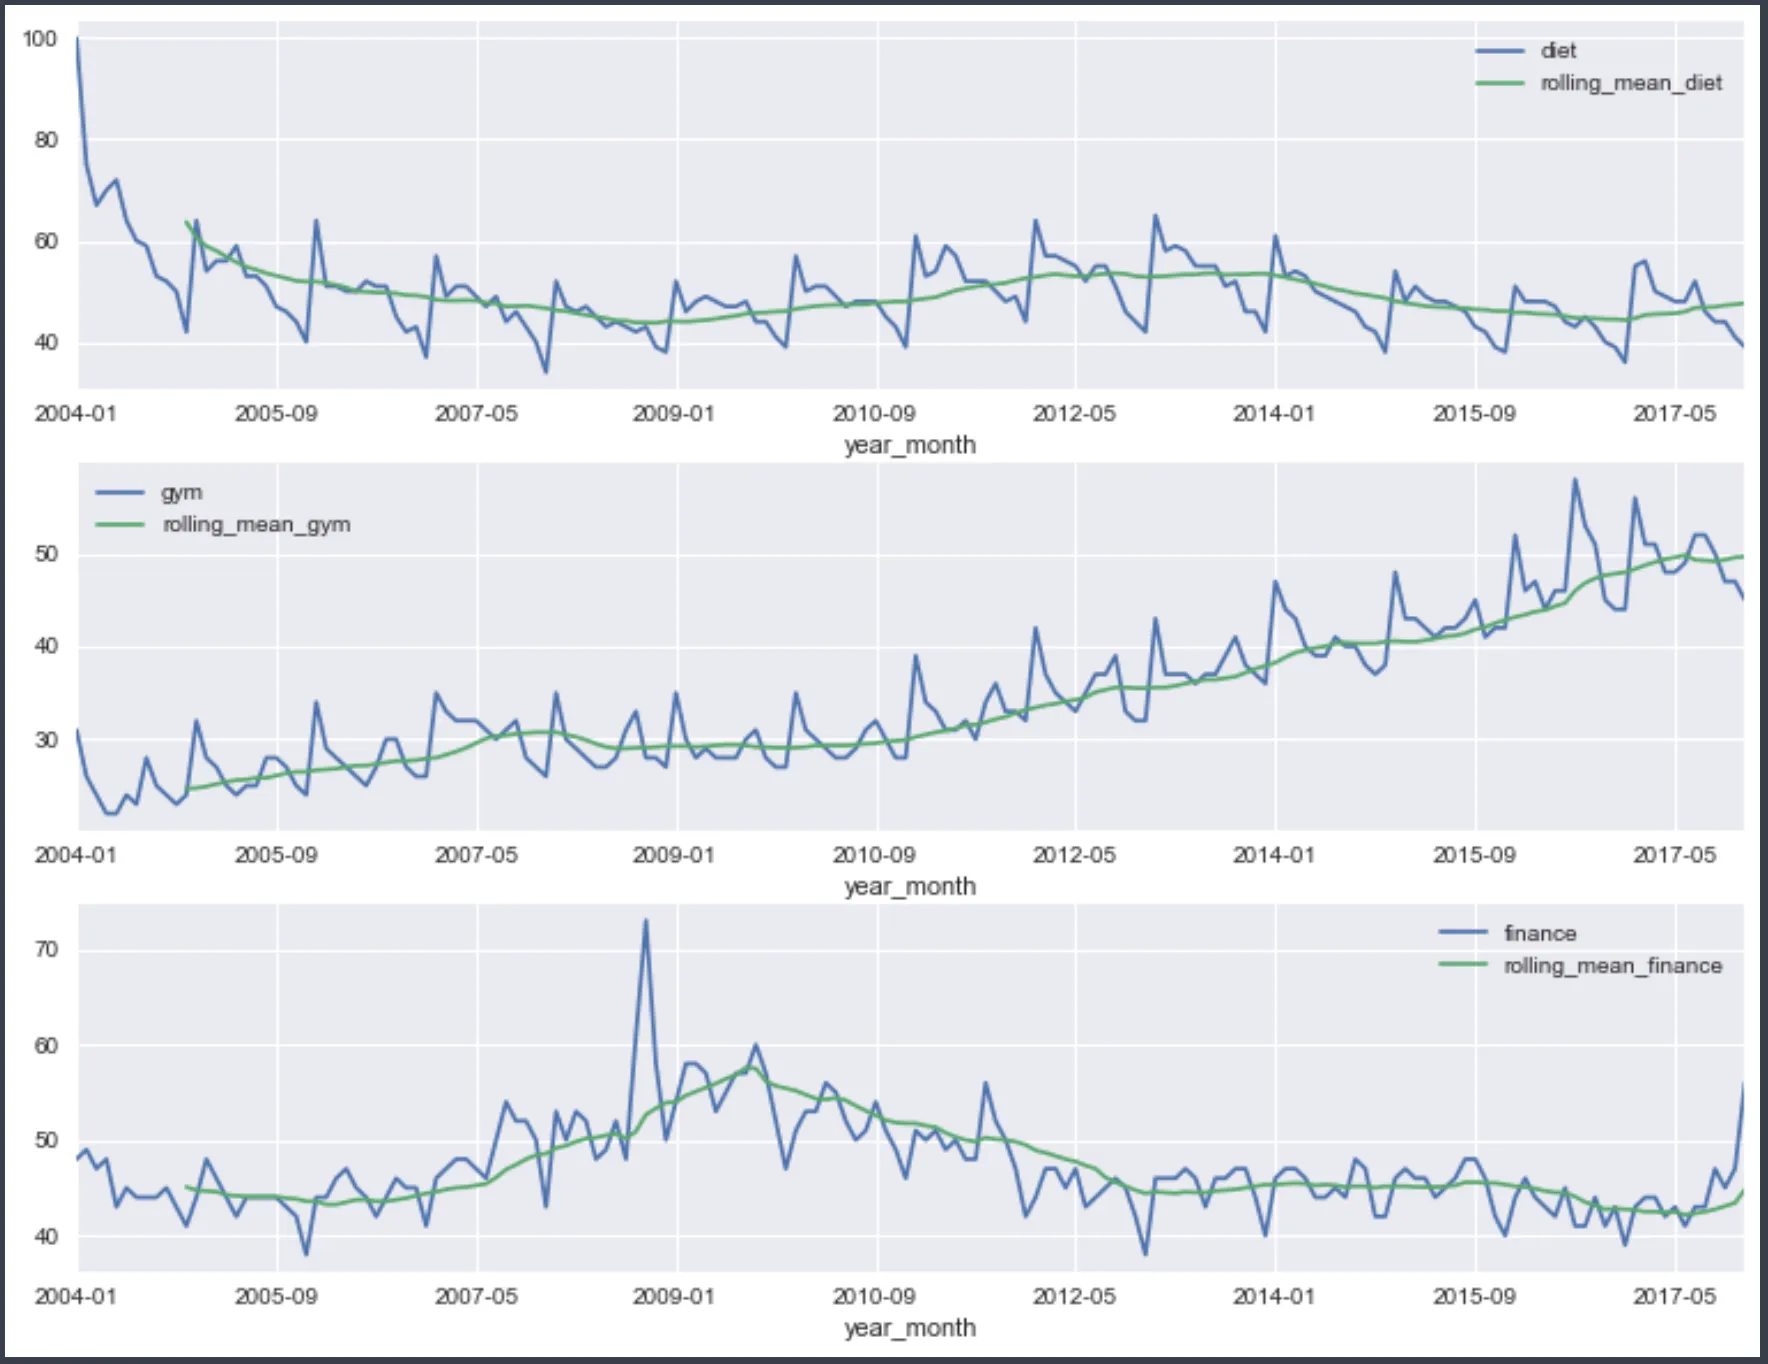
我通过使用以下代码计算时间序列的每一列的滚动平均值来创建下面的图表:
当我在plot()函数中设置color选项时,它会改变原始数据图和滚动平均图的颜色,这并不理想。
我通过使用以下代码计算时间序列的每一列的滚动平均值来创建下面的图表:
# calculate rolling mean
def rolling_mean(col):
    rolling_mean_col = 'rolling_mean_{}'.format(col)
    df[rolling_mean_col] = df[col].rolling(12).mean()

# create rolling mean columns
cols = ['diet', 'gym', 'finance']
for col in cols:
    rolling_mean(col)

# plot data in subplots
fig, axes = plt.subplots(nrows=3, ncols=1, figsize=(13,10));
df[['diet', 'rolling_mean_diet']].plot(ax=axes[0]);
df[['gym', 'rolling_mean_gym']].plot(ax=axes[1]);
df[['finance', 'rolling_mean_finance']].plot(ax=axes[2]);