我使用Python绘制了一张数据的表面图。
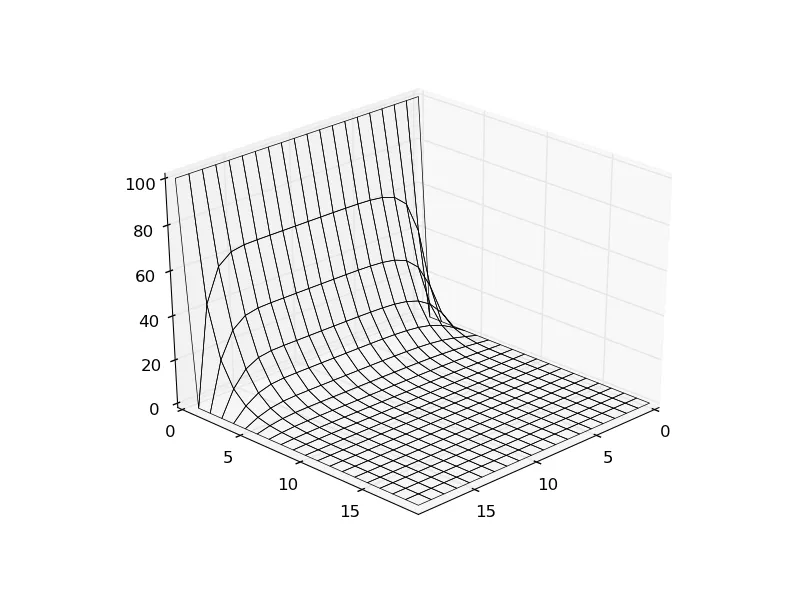
现在我想要改变这个图的样式。但是不幸的是,我卡在了线条颜色上。它的默认颜色是黑色,但我想将其改为红色或其他颜色。
我的代码如下:
from mpl_toolkits.mplot3d import Axes3D

import matplotlib.pyplot as plt
from matplotlib import cm
import numpy as np

data=np.loadtxt("test.txt")


def formateU(data):
   U = np.zeros((20,20))
   for value in data:
      U[value[0],value[1]] = value[2]
   return U

U = formateU(data)


y,x=np.meshgrid(np.linspace(0.,19,20),np.linspace(0.,19,20))

fig = plt.figure()

ax=plt.axes(projection='3d')

ax.plot_surface(x,y,U,rstride=1,cstride=1,alpha=0,linewidth=0.5)

ax.view_init(30, 45)

plt.savefig("test.png")

plt.show()
似乎很明显,在这里必须有一个额外的参数:
ax.plot_surface(x,y,U,rstride=1,cstride=1,alpha=0,linewidth=0.5)
但我无法理解它。
你能帮我吗?
test.txt可以在http://www.file-upload.net/download-8564062/test.txt.html找到。
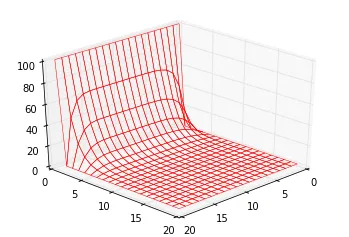
edgecolors='r'! - Jakobplot_surface()还可以接受color和cmap参数。 - MattDMo