我正在使用 MPAndroidChart库。我想自定义MPAndroidChart的图例。在MPAndroidChart库中,我尝试通过以下代码legend.setPosition(LegendPosition.BELOW_CHART_CENTER)来设置图例的位置,但无法实现。 我需要将图例设置为以下图像所示。
感谢您的帮助 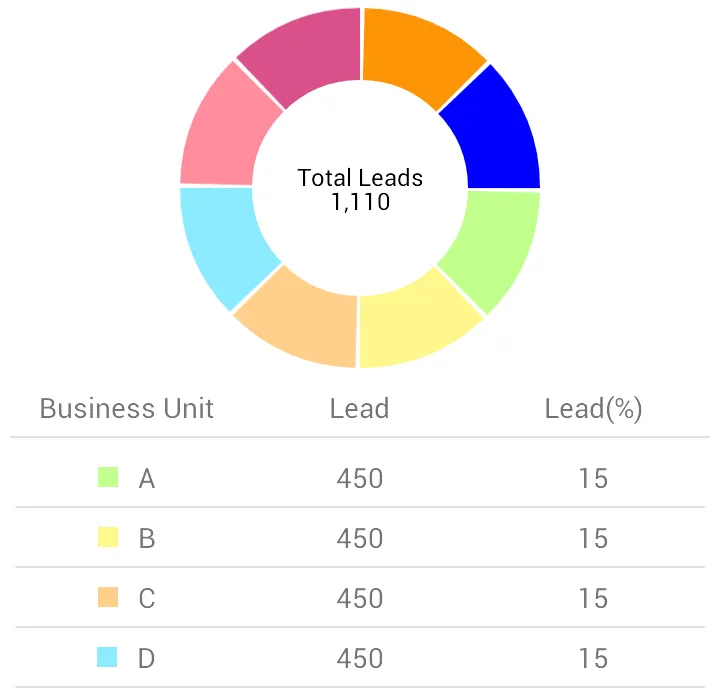
感谢您的帮助
Legend,并且自己构思实现方式。chart.getLegend().setEnabled(false)
ListView,从图表的Legend对象中获取数据并显示它。getColors(),getLegendLabels()),并将它们用于在ListView中显示。步骤1
Legend legend = mChart.getLegend();
步骤二
int colorcodes[] = legend.Colors();
步骤 3
for (int i = 0; i <  legend.Colors().length-1; i++) {
 .....
 .....
 }
步骤 4
然后,您需要选择水平或垂直布局,并获取图例颜色代码和图例标签,根据图例长度创建布局和标签。下面是代码示例:
        LinearLayout.LayoutParams parms_left_layout = new LinearLayout.LayoutParams(
                LayoutParams.MATCH_PARENT, LayoutParams.MATCH_PARENT);
        parms_left_layout.weight = 1F;
        LinearLayout left_layout = new LinearLayout(context);
        left_layout.setOrientation(LinearLayout.HORIZONTAL);
        left_layout.setGravity(Gravity.CENTER);
        left_layout.setLayoutParams(parms_left_layout);

        LinearLayout.LayoutParams parms_legen_layout = new LinearLayout.LayoutParams(
                20, 20);
        parms_legen_layout.setMargins(0, 0, 20, 0);
        LinearLayout legend_layout = new LinearLayout(context);
        legend_layout.setLayoutParams(parms_legen_layout);
        legend_layout.setOrientation(LinearLayout.HORIZONTAL);
        legend_layout.setBackgroundColor(colorcodes[i]);
        left_layout.addView(legend_layout);

        TextView txt_unit = new TextView(context);
        txt_unit.setText(legend.getLabel(i));
       left_layout.addView(txt_unit);

        LinearLayout.LayoutParams parms_middle_layout = new LinearLayout.LayoutParams(
                LayoutParams.MATCH_PARENT, LayoutParams.MATCH_PARENT);
        parms_middle_layout.weight = 1F;
        LinearLayout middle_layout = new LinearLayout(this);
        middle_layout.setOrientation(LinearLayout.HORIZONTAL);
        middle_layout.setGravity(Gravity.CENTER);
        middle_layout.setLayoutParams(parms_middle_layout);

        TextView txt_leads = new TextView(this);
        txt_leads.setText("450");
        middle_layout.addView(txt_leads);

        LinearLayout.LayoutParams parms_right_layout = new LinearLayout.LayoutParams(
                LayoutParams.MATCH_PARENT, LayoutParams.MATCH_PARENT);
        parms_right_layout.weight = 1F;
        LinearLayout right_layout = new LinearLayout(this);
        right_layout.setOrientation(LinearLayout.HORIZONTAL);
        right_layout.setGravity(Gravity.CENTER);
        right_layout.setLayoutParams(parms_right_layout);

        TextView txt_leads_percentage = new TextView(this);
        txt_leads_percentage.setText(munit_percentage_list.get(i) + "");
        right_layout.addView(txt_leads_percentage);

        childlayout.addView(left_layout);
        childlayout.addView(middle_layout);
        childlayout.addView(right_layout);
接下来,在主布局中添加您在运行时创建的(子布局)。
legend.Colors() deprecated https://github.com/PhilJay/MPAndroidChart/issues/3934#issuecomment-386039451 - itabdullah设置自定义图例:
public void setLegends(){

Legend l = holder.pieChart.getLegend();

l.getEntries();

l.setPosition(Legend.LegendPosition.BELOW_CHART_CENTER);

l.setYEntrySpace(10f);

l.setWordWrapEnabled(true);

LegendEntry l1=new LegendEntry("Male",Legend.LegendForm.CIRCLE,10f,2f,null,Color.YELLOW);
LegendEntry l2=new LegendEntry("Female", Legend.LegendForm.CIRCLE,10f,2f,null,Color.RED);

l.setCustom(new LegendEntry[]{l1,l2});

l.setEnabled(true);

}
    <TableRow xmlns:android="http://schemas.android.com/apk/res/android"
        android:layout_width="fill_parent"
        android:layout_height="wrap_content"
        android:gravity="center"
        android:weightSum="3">
        <LinearLayout
            android:id="@+id/tv_color_container"
            android:layout_width="0dp"
            android:layout_height="match_parent"
            android:layout_gravity="center"
            android:layout_weight="0.30"
            android:orientation="horizontal"
            android:gravity="right"
            android:padding="5dp">

            <LinearLayout
                android:id="@+id/tv_color"
                android:layout_width="20dp"
                android:layout_height="20dp"
                android:layout_gravity="center"

                android:orientation="horizontal"
              />
        </LinearLayout>

        <TextView
            android:id="@+id/tv_label"
            android:layout_width="0dp"
            android:layout_gravity="top"
            android:layout_weight="1.35"

            android:gravity="left|top"
            android:padding="3dp"
            android:singleLine="true"

            android:textColor="#2b2b2b"
            android:textSize="16sp" />

        <TextView
            android:id="@+id/tv_amt"
            android:layout_width="0dp"
            android:layout_weight="1.35"
            android:gravity="left|top"
            android:padding="3dp"

            android:textColor="#2b2b2b"
            android:textSize="16sp" />
    </TableRow>
LinearLayout,并将父布局包装在具有静态高度到饼图的滚动布局中。 <?xml version="1.0" encoding="utf-8"?>
<ScrollView
xmlns:android="http://schemas.android.com/apk/res/android"
android:layout_width="match_parent"
android:background="#ffffff"
android:layout_height="match_parent">
<RelativeLayout
xmlns:android="http://schemas.android.com/apk/res/android"
android:layout_width="match_parent"
android:layout_height="match_parent"
android:layout_marginTop="10dp"
android:paddingBottom="10dp"
android:layout_marginBottom="10dp"
android:layout_centerInParent="true"
>
<com.github.mikephil.charting.charts.PieChart
android:id="@+id/chart1"
android:layout_width="match_parent"
android:layout_height="400dp"
android:layout_below="@+id/tv_info"
android:layout_centerHorizontal="true"
android:layout_marginTop="10dp"
android:background="#ffffff"
android:clickable="true" />
<TableLayout
android:id="@+id/child_layout"
android:layout_width="match_parent"
android:layout_height="wrap_content"
android:layout_below="@+id/chart1"
android:orientation="vertical" />
</RelativeLayout>
</ScrollView>
public void setCustomLegend(){
        int colorcodes[] = l.getColors();
        Context context = DistributorGraphActivity.this;
        for (int i = 0; i < l.getColors().length - 1; i++) {
            LayoutInflater inflater = getLayoutInflater();
            TableRow tr = (TableRow)          inflater.inflate(R.layout.table_row_legend,
                    childlayout, false);
            childlayout.addView(tr);
            LinearLayout linearLayoutColorContainer=(LinearLayout) tr.getChildAt(0);
            LinearLayout linearLayoutColor= (LinearLayout)           linearLayoutColorContainer.getChildAt(0);
            TextView tvLabel = (TextView) tr.getChildAt(1);
            TextView tvAmt = (TextView) tr.getChildAt(2);
            linearLayoutColor.setBackgroundColor(colorcodes[i]);
            tvLabel.setText(l.getLabel(i));
            tvAmt.setText(arrListDealerGraph.get(i).getAmt());
        }
        mChart.getLegend().setWordWrapEnabled(true);
        mChart.getLegend().setEnabled(false);
}
对于 Kotlin,命令是:
mChart.legend.isEnabled = false