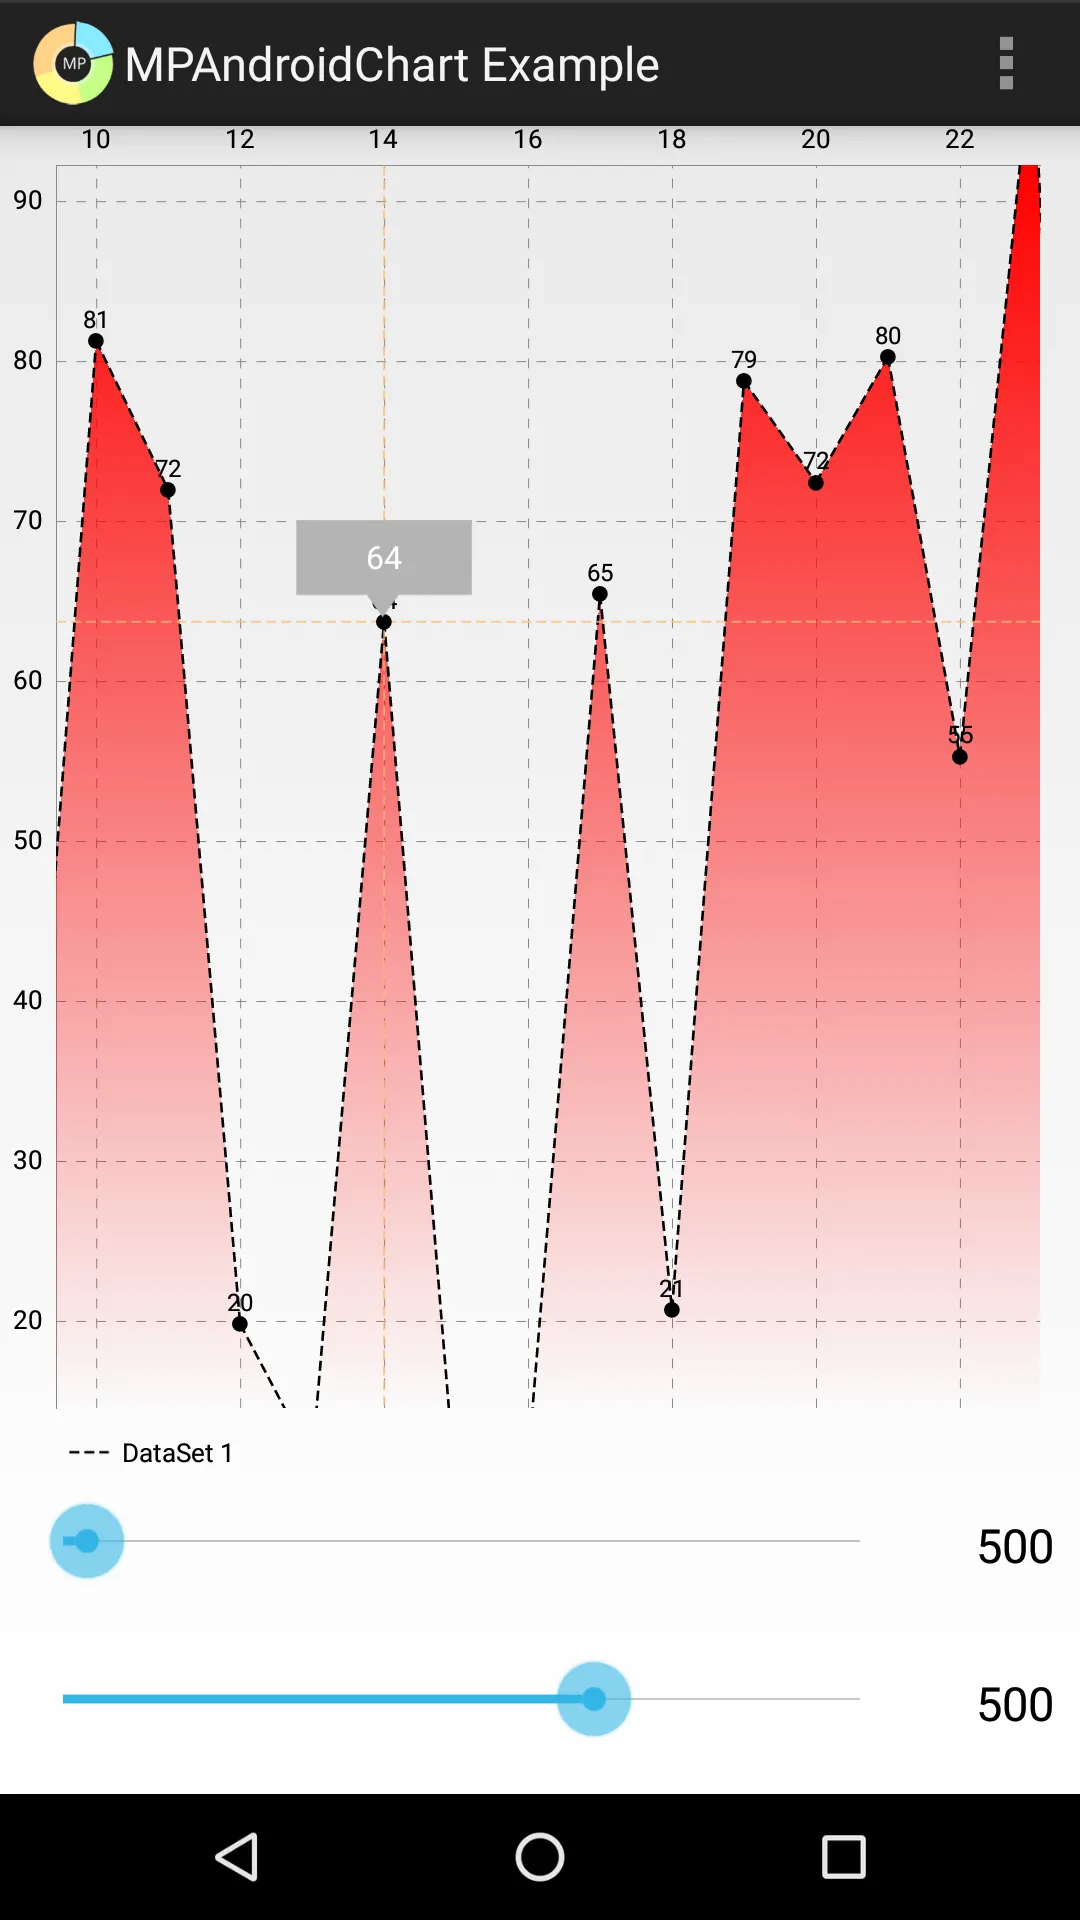
确保您拥有最新版本的MPAndroidChart(3.0.1)。克隆,构建并在设备上运行示例项目。您可以看到菜单中的第一个示例称为“折线图-线性图表的简单演示”具有您想要的高亮视图。它看起来像这样:
代码位于示例项目中的
LineChartActivity1中。XML如下:
    <TextView
        android:id="@+id/tvContent"
        android:layout_width="wrap_content"
        android:layout_height="wrap_content"
        android:layout_centerHorizontal="true"
        android:layout_marginTop="7dp"
        android:layout_marginLeft="5dp"
        android:layout_marginRight="5dp"
        android:text=""
        android:textSize="12dp"
        android:textColor="@android:color/white"
        android:ellipsize="end"
        android:singleLine="true"
        android:textAppearance="?android:attr/textAppearanceSmall" />

</RelativeLayout>
标记视图如下:
package com.xxmassdeveloper.mpchartexample.custom;
import android.content.Context;
import android.widget.TextView;
import com.github.mikephil.charting.components.MarkerView;
import com.github.mikephil.charting.data.CandleEntry;
import com.github.mikephil.charting.data.Entry;
import com.github.mikephil.charting.highlight.Highlight;
import com.github.mikephil.charting.utils.MPPointF;
import com.github.mikephil.charting.utils.Utils;
import com.xxmassdeveloper.mpchartexample.R;
public class MyMarkerView extends MarkerView {
private TextView tvContent;
public MyMarkerView(Context context, int layoutResource) {
super(context, layoutResource);
tvContent = (TextView) findViewById(R.id.tvContent);
}
@Override
public void refreshContent(Entry e, Highlight highlight) {
if (e instanceof CandleEntry) {
CandleEntry ce = (CandleEntry) e;
tvContent.setText("" + Utils.formatNumber(ce.getHigh(), 0, true));
} else {
tvContent.setText("" + Utils.formatNumber(e.getY(), 0, true));
}
super.refreshContent(e, highlight);
}
@Override
public MPPointF getOffset() {
return new MPPointF(-(getWidth() / 2), -getHeight());
}
}
它的使用方法如下:
MyMarkerView mv = new MyMarkerView(this, R.layout.custom_marker_view)
mv.setChartView(mChart)