是否可以用自定义布局替换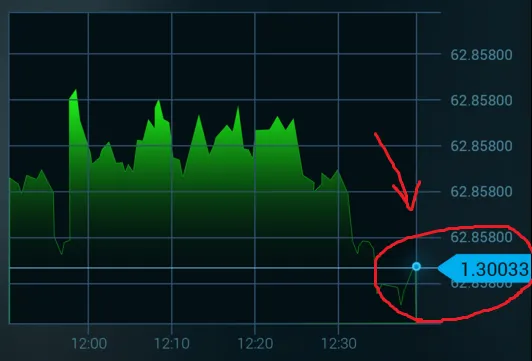 。我看到了一些解决方案:
编辑:最新部分解决方案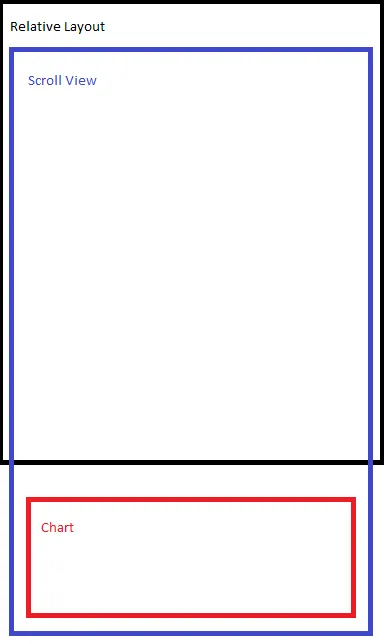
LimitLine?这样它看起来像这样:。我看到了一些解决方案:
- 也许库中有类似这样的自定义方法,有吗?
- 获取存储值的
TextView的坐标,并在该位置添加自定义布局。但是我怎样可以找到这个TextView呢?
编辑:最新部分解决方案
经过长时间的寻找解决方案,我得出了通过Limit Line坐标添加自定义视图的结论。
屏幕的通用布局如下:
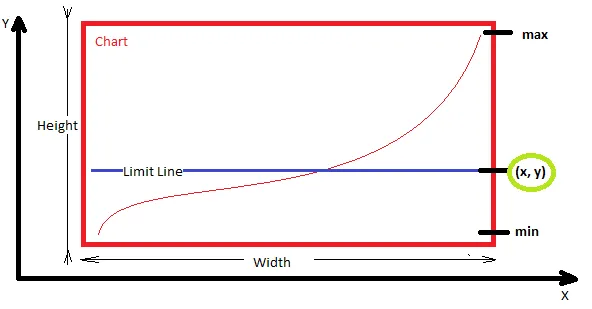
坐标计算非常简单。X从图表坐标中已知且Y为:
Y = ((max - lastValue) * height) / ((max + min) + y)
因此,我基本上知道我需要的位置。虽然由于父级ScrollView,我不确定它是否正确。
下一步是在这些坐标(x,y)处添加自定义布局。
这里出现了新的问题。我试图将视图添加到顶部的RelativeLayout中。它被添加了,但它不会随着ScrollView一起移动。因此,需要将该视图添加到图表上。看看我如何实现它:
private void addCustomLayoutOnLimitLine(final double lastValue) {

    mChart.post(new Runnable() { //check location when view is created
        public void run() {
            int[] chartLocationOnScreen = new int[2];
            mChart.getLocationOnScreen(chartLocationOnScreen);

            int x = chartLocationOnScreen[0];
            int y = chartLocationOnScreen[1];

            int width = mChart.getWidth();
            int height = mChart.getHeight();


            double max = mChart.getYMax();
            double min = mChart.getYMin();

            int limitXPoint = x + width;
            int limitYPoint = (int) ((((max - lastValue) * height) / (max + min))+ y);


            LayoutInflater inflater = (LayoutInflater)   getContext().getSystemService(Context.LAYOUT_INFLATER_SERVICE);
            RelativeLayout rlValue = (RelativeLayout) inflater.inflate(R.layout.item_chart_value, null);
            TextView tvValue = (TextView) rlValue.findViewById(R.id.tv_value);
            tvValue.setText(String.valueOf(lastValue));

            RelativeLayout.LayoutParams params = new RelativeLayout.LayoutParams(50, 50);
            params.leftMargin = limitXPoint - 100;
            params.topMargin = limitYPoint;
            mChart.addView(rlValue, params); //this doesn't seem to be working
            rlValue.bringToFront();
        }
    });
}
也许我应该到Chart的父布局中去查找并填充自定义布局。但是如何做到呢?
编辑2:在图表上添加了自定义视图,但由于滚动视图找不到合适的位置
现在情况看起来像这样:
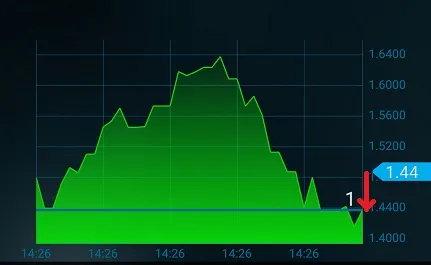
也许我的计算有误。但至少该视图随着新值而改变其位置,尽管它从未到达正确的坐标。
private void addCustomLayoutOnLimitLine() {
    if (mChart == null){
        return;
    }

    mChart.post(new Runnable() { //check location when view is created
        public void run() {
            int[] chartLocationOnScreen = new int[2];
            mChart.getLocationOnScreen(chartLocationOnScreen);

            int xChart = chartLocationOnScreen[0];
            int yChart = chartLocationOnScreen[1];

            int chartWidth = mChart.getWidth();
            int chartHeight = mChart.getHeight();

            int rootWidth = rlSvContent.getWidth();
            int rootHeight = rlSvContent.getHeight(); //this is height of ScrollView

            int infoWidth = llInfoWrapper.getWidth(); //width of info panel ABOVE chart
            int infoHeight = llInfoWrapper.getHeight();

            double lastValue = mSingleAsset.getGraph().get(mSingleAsset.getGraph().size() - 1).getValue();
            double maxValue = mChart.getYMax();
            double minValue = mChart.getYMin();

            int limitXPoint = (rootWidth - chartWidth) / 2 + chartWidth;
            int limitYPoint = (int) ((maxValue - lastValue) * chartHeight/(maxValue - minValue)) + yChart;

            tvCustomValue.setText(SingleAsset.round((float) lastValue, 2).toString()); //display last value on custom view

            RelativeLayout.LayoutParams params = new RelativeLayout.LayoutParams(ViewGroup.LayoutParams.WRAP_CONTENT, ViewGroup.LayoutParams.WRAP_CONTENT);
            params.leftMargin = limitXPoint - xChart - 50; //move custom view. xChart = right margin value and 50 is taken to count values bar to the right of chart
            params.topMargin = limitYPoint;
            rlCustomValue.setLayoutParams(params);
            rlCustomValue.bringToFront();
            rlCustomValue.invalidate();
        }
    });
}
ll = new LimitLine(limit, label); ll.setLineColor(...); yourChart.getAxisRight().addLimitLine(ll);- Stefan Bushev