如何在MPAndroidChart中隐藏图例和坐标轴?

71

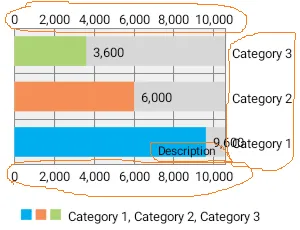
有没有可能隐藏这张图片中所有的圆形物品。

enter image description here

我已经使用了以下代码,

public void setDataList(List<HorizontalBarChartData> dataList, Resources resources) {

    ArrayList<String> categories = new ArrayList<String>();
    ArrayList<BarEntry> values = new ArrayList<BarEntry>();
    ArrayList<BarDataSet> dataSets = new ArrayList<BarDataSet>();
    BarDataSet set1;
    for (int i = 0; i < dataList.size(); i++) {
        categories.add(dataList.get(i).getName());
        values.add(new BarEntry(dataList.get(i).getValue(), i));
    }

    /*set1 = new BarDataSet(values, "Income, Expense, Disposable Income");*/
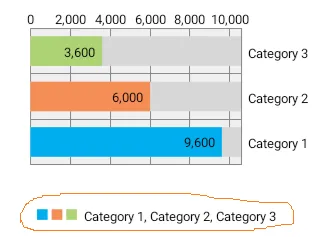
    set1 = new BarDataSet(values, "Category 1, Category 2, Category 3");
    set1.setBarSpacePercent(35f);
    set1.setColors(new int[]{resources.getColor(R.color.cyan_blue), resources.getColor(R.color.vermilion_tint), resources.getColor(R.color.sea_green)});
    dataSets.add(set1);

    BarData data = new BarData(categories, dataSets);
    data.setValueTextSize(10f);

    horizontalBarChart.setData(data);
}

更新

如何隐藏这张图片的圆形部分?

enter image description here


你的 MPAndroidChart 代码在哪里? - Raptor
嘿,@Gunaseelan,你能看一下这个吗?http://stackoverflow.com/questions/38975333/mpandroidchart-horizontalbarchart-customize-label?noredirect=1#comment65304760_38975333 - Cloy
你是如何在那些条形图上方写字的?有人能告诉我吗? - Muhammad Saad Rafique
9个回答

206

是的,可以,只需使用以下代码:

mChart.setDescription("");    // Hide the description
mChart.getAxisLeft().setDrawLabels(false);
mChart.getAxisRight().setDrawLabels(false);
mChart.getXAxis().setDrawLabels(false);

mChart.getLegend().setEnabled(false);   // Hide the legend 

我的MPAndroidChart版本是v2.0.7。 - codezjx
能否隐藏“类别1、类别2、类别3”图例? - Gunaseelan
1
是的,兄弟,你可以使用mChart.getLegend().setEnabled(false)来隐藏图例,但要小心:在调用此方法之前,您需要为图表设置数据。这意味着您应该在mChart.setData()之后调用。 - codezjx
1
我们可以隐藏背景框吗? - Gunaseelan
1
在v3.0.3中隐藏描述需要执行以下操作:Description description = new Description(); description.setText(""); mChart.setDescription(description); - Sergey Stasishin
显示剩余4条评论

7
根据这个答案mChart.getXAxis().setDrawLabels(false);将隐藏整个X轴(符合此问题的要求)。以下代码用于定位X轴。
    XAxis xAxis = mChart.getXAxis();
    xAxis.setPosition(XAxis.XAxisPosition.BOTTOM);

可以设置位置为

  • BOTTOM(底部)
  • BOTH_SIDED(双侧)
  • BOTTOM_INSIDE(内部底部)
  • TOP(顶部)
  • TOP_INSIDE(内部顶部)

这有助于仅隐藏特定侧轴而不是隐藏整个轴。


7

看起来mChart.setDescription()不再接受字符串。

现在该方法接受一个Description类的实例,如下所示:mChart.setDescription(Description description)

因此,要修改或删除图表描述,可以按以下方式进行操作:

Description description = new Description();
description.setText("");
mChart.setDescription(description);

5
以下代码适用于所有图表: Legend l = mchart.getLegend(); l.setEnabled(false);
(该代码用于隐藏图例)

4

要隐藏描述,请使用此代码

mChart.getDescription().setEnabled(false)

1
以下代码适用于饼图。请尝试为您的图表获得相同的方法。
Legend l = mChart.getLegend();
l.setPosition(LegendPosition.NONE);

@Gunaseelan 没有horizontalBarChart.getLegend()方法可用吗? - Pooja
不,Legend.LegendPosition.NONE 不可用。 - Gunaseelan
3
已移除 LegendPosition.NONE。请使用 legend.setEnabled(false) 替代。 - Philipp Jahoda

1
chart=(LineChart) findViewById(R.id.Chart);
chart.getLegend().setEnabled(false); // for hiding square on below graph

1

针对MPAndroidChart:v3.1.0的Kotlin解决方案

chart.description.isEnabled = false // hide the description
chart.legend.isEnabled = false // hide the legend 

chart.xAxis.setDrawLabels(false) // hide bottom label
chart.axisLeft.setDrawLabels(false) // hide left label
chart.axisRight.setDrawLabels(false) // hide right label

0

我遇到了一个问题,当我使用mChart.getLegend().setEnabled(false)时,底部x轴标签被截断了。

现在我改用chart.getLegend().setForm(Legend.LegendForm.NONE);,标签不再被截断了。


网页内容由stack overflow 提供, 点击上面的
可以查看英文原文,
原文链接