如何从数据列表创建直方图并使用matplotlib绘制

36

我已经安装了matplotlib并尝试从一些数据创建直方图:

#!/usr/bin/python

l = []
with open("testdata") as f:
    line = f.next()
    f.next()  # skip headers
    nat = int(line.split()[0])
    print nat

    for line in f:
        if line.strip():
          if line.strip():
            l.append(map(float,line.split()[1:]))

    b = 0
    a = 1

for b in range(53):
    for a in range(b+1, 54):
        import operator
        import matplotlib.pyplot as plt
        import numpy as np

        vector1 = (l[b][0], l[b][1], l[b][2])
        vector2 = (l[a][0], l[a][1], l[a][2])

        x = vector1
        y = vector2
        vector3 = list(np.array(x) - np.array(y))
        dotProduct = reduce( operator.add, map( operator.mul, vector3, vector3))
    
        dp = dotProduct**.5
        print dp
    
        data = dp
        num_bins = 200  # <- number of bins for the histogram
        plt.hist(data, num_bins)
        plt.show()

我从代码的最后一部分得到了一个错误:

/usr/lib64/python2.6/site-packages/matplotlib/backends/backend_gtk.py:621:     DeprecationWarning: Use the new widget gtk.Tooltip
  self.tooltips = gtk.Tooltips()
Traceback (most recent call last):
  File "vector_final", line 42, in <module>
plt.hist(data, num_bins)
  File "/usr/lib64/python2.6/site-packages/matplotlib/pyplot.py", line 2008, in hist
ret = ax.hist(x, bins, range, normed, weights, cumulative, bottom, histtype, align, orientation, rwidth, log, **kwargs)
  File "/usr/lib64/python2.6/site-packages/matplotlib/axes.py", line 7098, in hist
w = [None]*len(x)
TypeError: len() of unsized object

但无论如何,你有没有想过如何创建200个等距的箱子,并让你的程序将数据存储在相应的箱子中?

2
将您的import语句放在文件顶部,而不是循环内部。 - MattDMo
好的,我试过了,但是似乎没有解决问题,不过我猜这只是一个效率问题? - Wana_B3_Nerd
1
效率(部分)和风格。 - MattDMo
好的,你有没有想法如何创建200个等距的箱子,并让程序将数据存储在相应的箱子中? - Wana_B3_Nerd
3个回答

65
你有没有想过如何创建200个等间距的箱子,并让程序将数据存储在相应的箱子中?
例如,您可以使用NumPy的arange来设置固定的箱子大小(或Python的标准范围对象),并使用NumPy的linspace来创建等间距的箱子。以下是我matplotlib gallery中的两个简单示例。

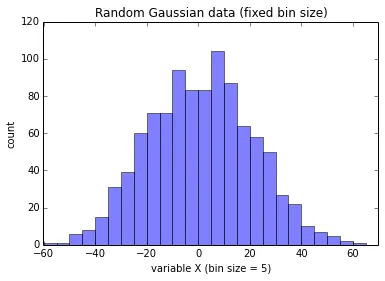
固定箱子大小

import numpy as np
import random
from matplotlib import pyplot as plt

data = np.random.normal(0, 20, 1000) 

# fixed bin size
bins = np.arange(-100, 100, 5) # fixed bin size

plt.xlim([min(data)-5, max(data)+5])

plt.hist(data, bins=bins, alpha=0.5)
plt.title('Random Gaussian data (fixed bin size)')
plt.xlabel('variable X (bin size = 5)')
plt.ylabel('count')

plt.show()

enter image description here

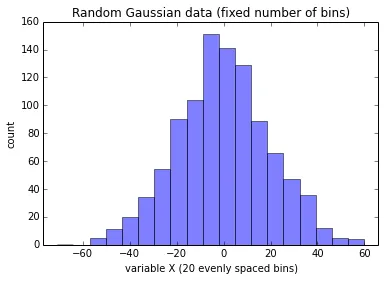
固定数量的箱子

import numpy as np
import math
from matplotlib import pyplot as plt

data = np.random.normal(0, 20, 1000) 

bins = np.linspace(math.ceil(min(data)), 
                   math.floor(max(data)),
                   20) # fixed number of bins

plt.xlim([min(data)-5, max(data)+5])

plt.hist(data, bins=bins, alpha=0.5)
plt.title('Random Gaussian data (fixed number of bins)')
plt.xlabel('variable X (20 evenly spaced bins)')
plt.ylabel('count')

plt.show()

enter image description here


1
我发现这非常有帮助。我删除了“import random”行,没有发现任何不良影响。这里实际上需要吗?我了解我们调用一个名为random.normal的函数,但如果我正确理解脚本,这个函数是numpy模块的一部分。 - Carl Christian
很高兴这个有帮助!说得好,import random 这行代码看起来像是废弃的导入,并没有在那段代码片段中被使用。已在答案中编辑。谢谢! - user2489252
math.floor和ceil的顺序不应该反过来吗? 我本以为应该是: np.linspace(math.floor(min(data)), math.ceil(max(data)),20) - Zeh

6

自动划分数据区间

如何将数据均匀地划分为200个区间,并让程序将数据存储到相应的区间中?

接受的答案使用np.arangenp.linspace手动创建了200个区间,但是Matplotlib已经可以自动完成此操作:

  1. plt.hist itself returns counts and bins

    counts, bins, _ = plt.hist(data, bins=200)
    

如果需要在绘图之前获取箱线图数据:

  1. np.histogram with plt.stairs

    counts, bins = np.histogram(data, bins=200)
    plt.stairs(counts, bins, fill=True)
    

    Note that stair plots require matplotlib 3.4.0+.

  2. pd.cut with plt.hist

    _, bins = pd.cut(data, bins=200, retbins=True)
    plt.hist(data, bins)
    

    histogram output


3

有几种方法可以实现这个目标。

如果你不能保证你的物品都是同一类型和数值,那么请使用内置的标准库collections

import collections
hist = dict(collections.Counter(your_list))

否则,如果您的数据保证是同一类型和数字,则使用Python模块numpy:
import numpy as np
# for one dimensional data
(hist, bin_edges) = np.histogram(your_list)
# for two dimensional data
(hist, xedges, yedges) = np.histogram2d(your_list)
# for N dimensional data
(hist, edges) = np.histogramdd(your_list)

NumPy的直方图功能是最高级的选择,因为np.histogram可以尝试计算需要多少个箱子,可以进行加权处理,并且所有使用的算法都有很好的文档和示例代码。


网页内容由stack overflow 提供, 点击上面的
可以查看英文原文,
原文链接