无法实现的最小示例:
[X,Y,Z] = peaks;
figure;
pcolor(X,Y,Z);
shading flat;
hold all;
axes;
contour(X,Y,Z);
colormap gray;  % this should only apply to the contour plot axes...
axis off;       % ... but it doesn't
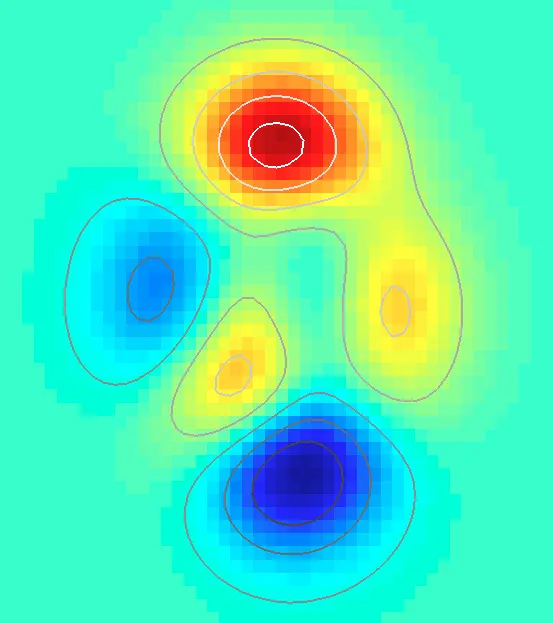
这显示了轮廓图和伪彩色图,使用灰度调色板。然而,我想要实现的只是将轮廓变成灰色。
这只是一个极简的例子,在实际情况中,轮廓图是不同数据的,具有不同的范围,因此还需要两个独立的caxis设置。