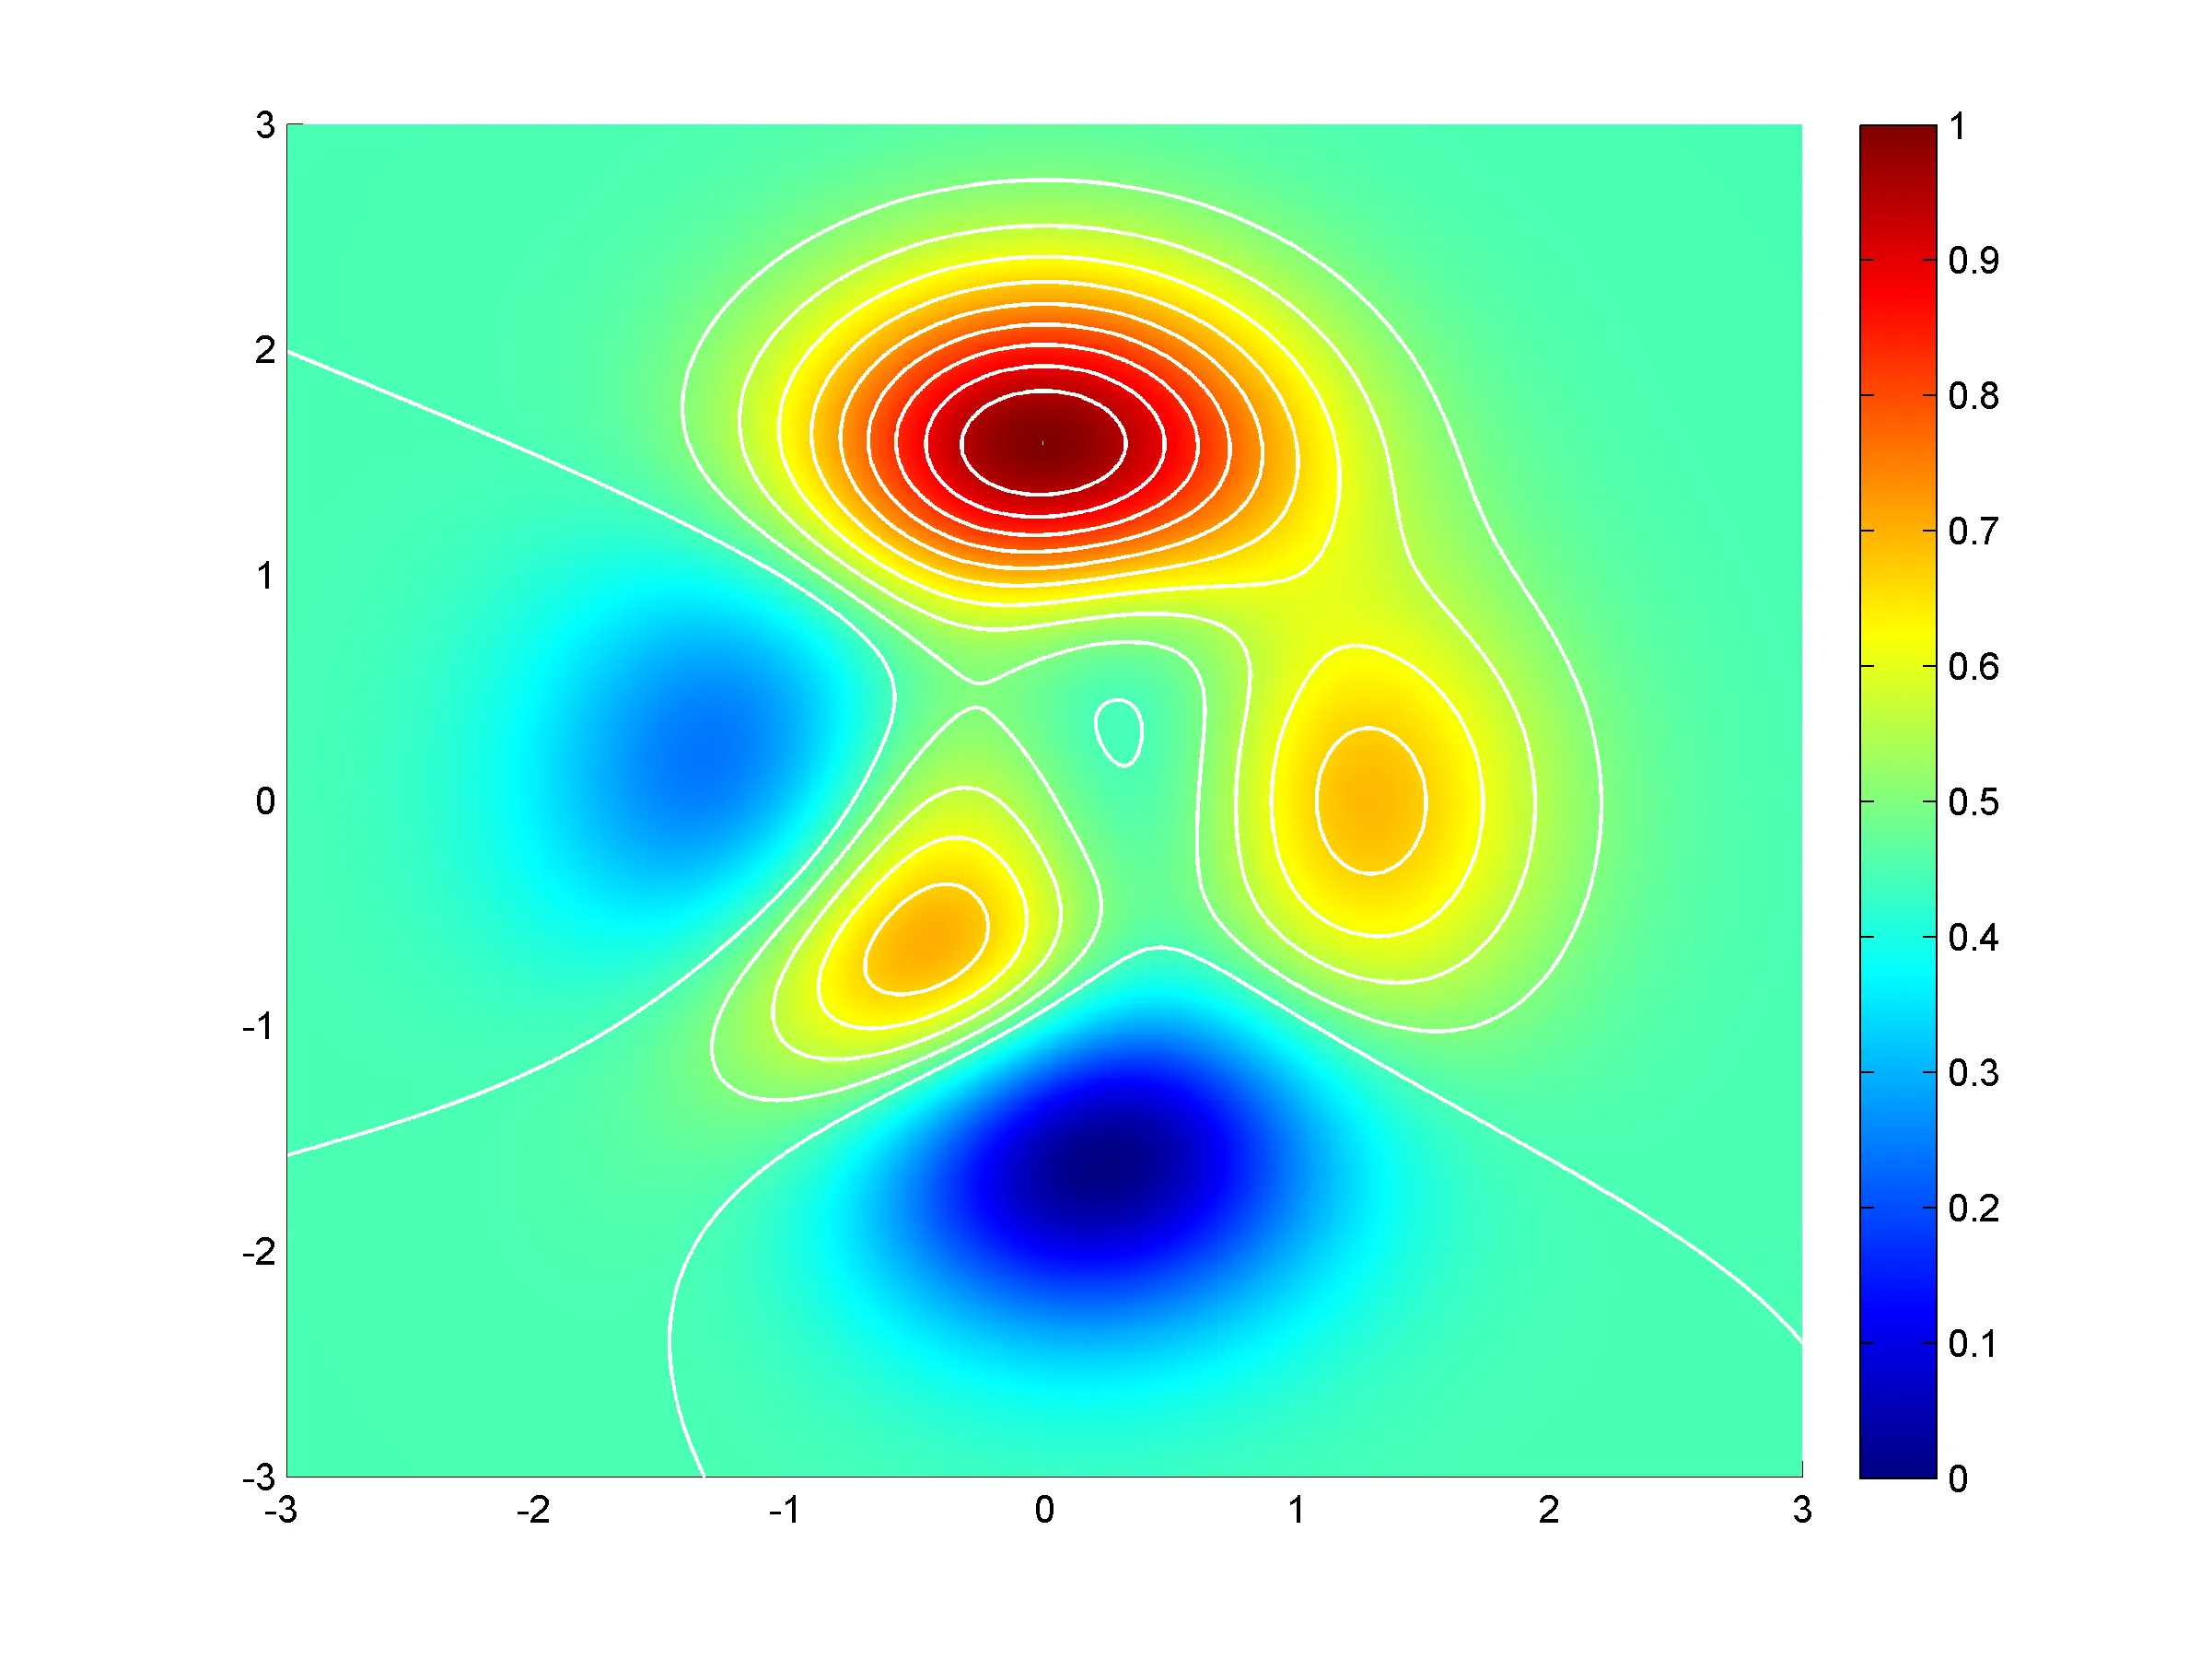
我正在使用pcolor与等高线图。然而,从图中无法识别出线的值,如下图所示。
[x y data] = peaks(1000);
data = data / max(max(data));

colorDepth = 1000;
colormap(jet(colorDepth));

hold on;
pcolor(x,y,data); shading flat

[C,hfigc] = contour(x, y, data,[0:0.1:1]);
set(hfigc, ...
    'LineWidth',1.0, ...
    'Color', [1 1 1]);
hold off;
hcb = colorbar('location','EastOutside');
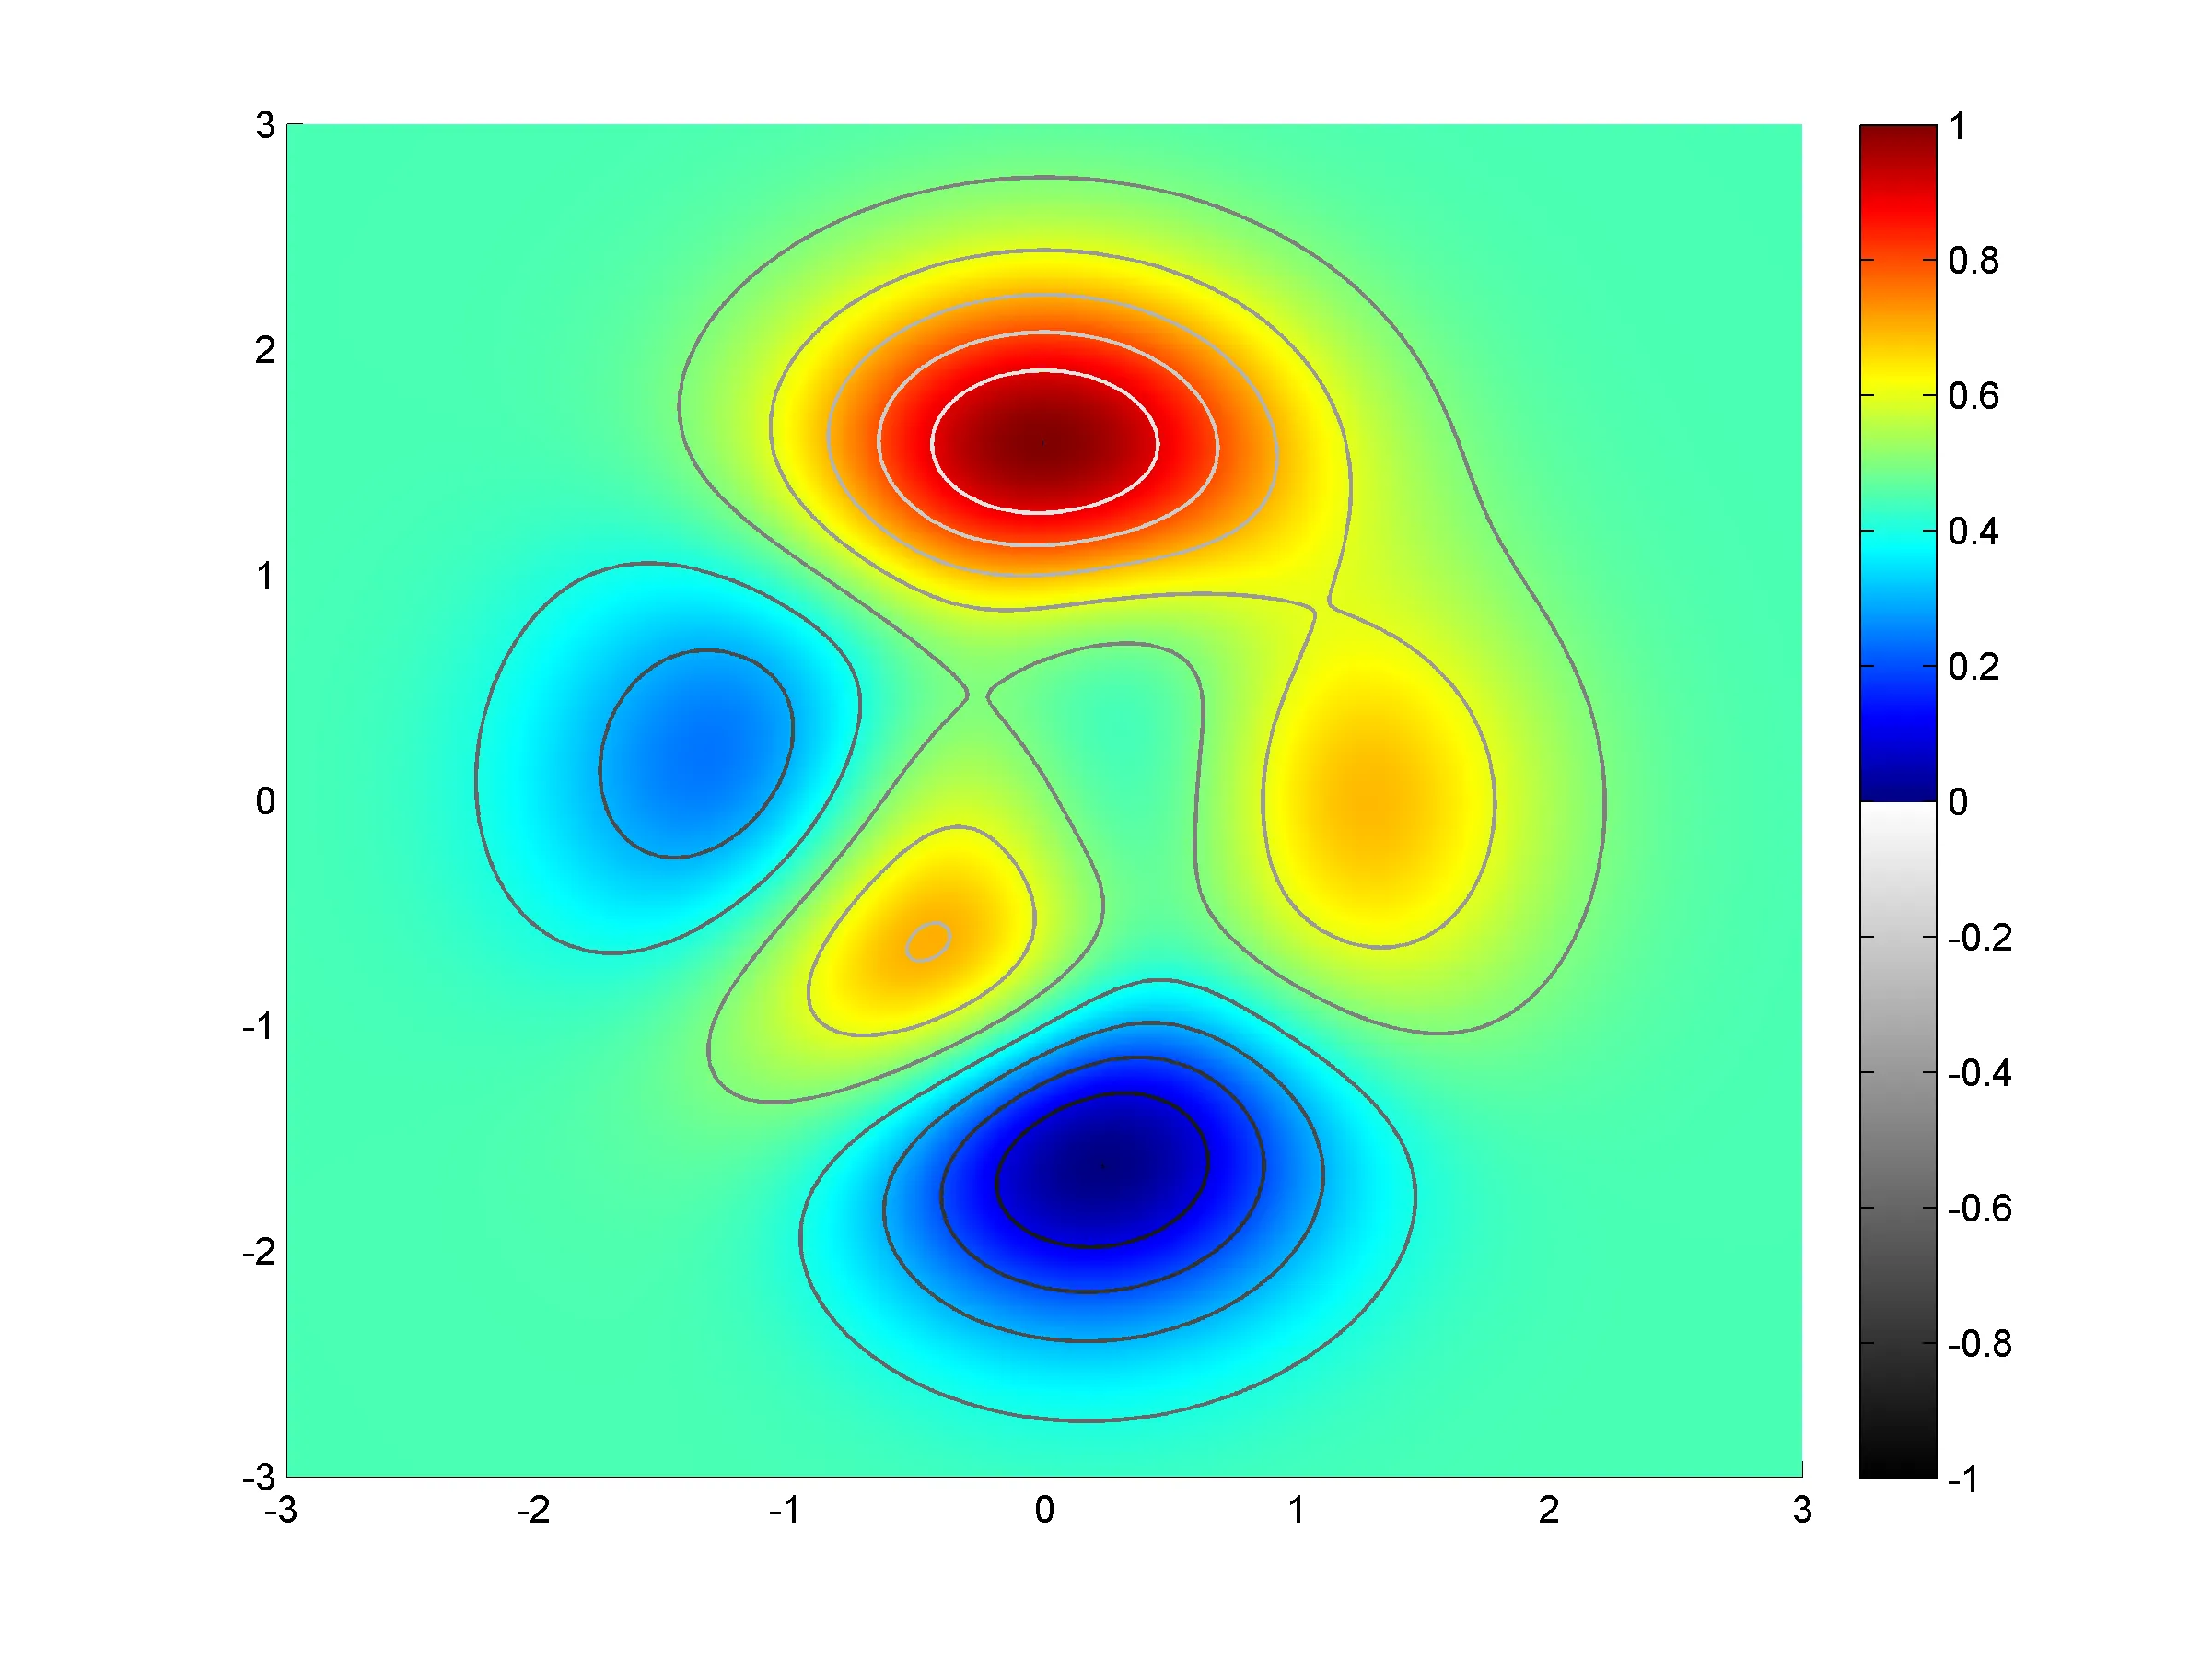
我更希望pcolor中的颜色为灰度值,轮廓线为彩色。但是这样我也需要一个轮廓线的图例。
编辑: 通过组合两个colormap,它以某种方式起作用,但是此时颜色栏显示了两者,这不是我想要的。我更希望有一个颜色栏,其中包含与绘图相同的轮廓线。
[x y data] = peaks(1000);
data = data - min(min(data));
data = data / max(max(data));

colorDepth = 1000;

hold on;
caxis([-1 1]);
colormap([gray(colorDepth); jet(colorDepth)]);
hplot = pcolor(x,y,data); shading flat

[C,hfigc] = contour(x, y, data-1,[-1:0.1:0]);
set(hfigc, 'LineWidth',1.0);
% set(hfigc, 'Color', [1 1 1]);

hold off;
hcb = colorbar('location','EastOutside');
编辑: 可以通过以下方式更正colorbar:
set(hcb, 'Ylim', [0 1]);
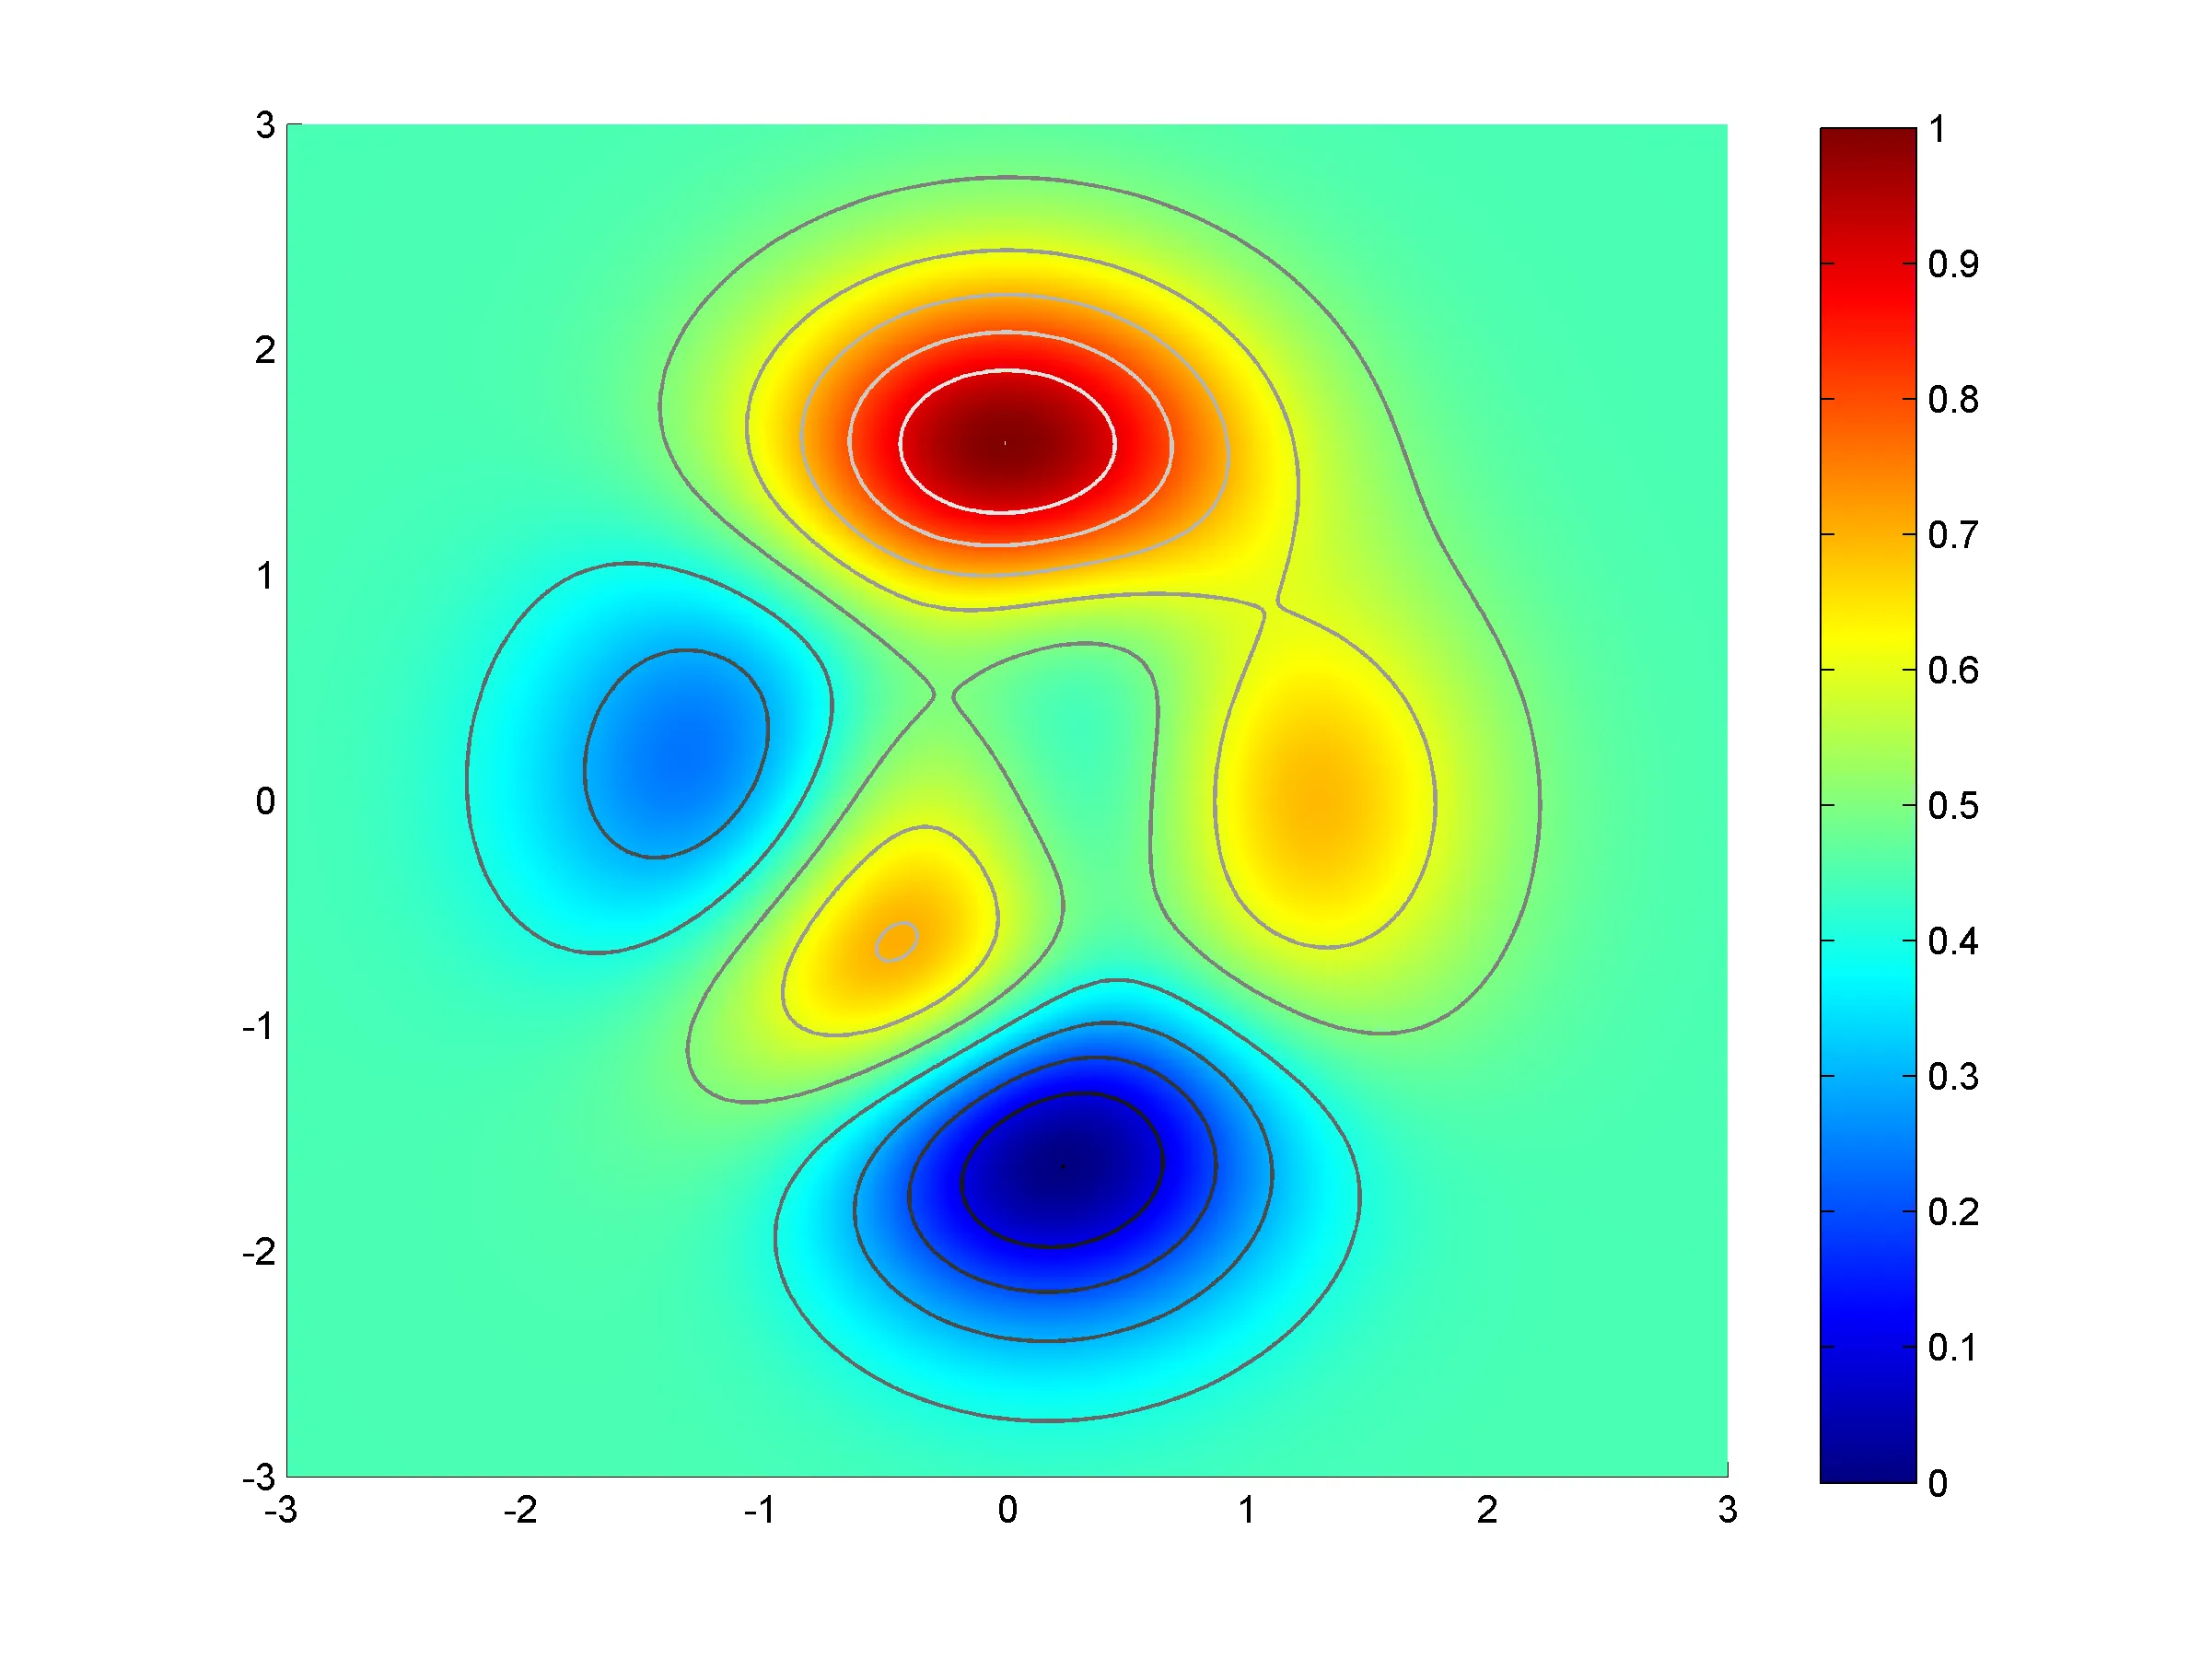
zlevs的定义(并且有一个小错别字)。 - Itamar Katzhcb。所以你可以这样做:set(hcb,'ylim',[0 1])。当前轴的句柄是gca。一般来说,查看你正在使用的图形函数的文档,它通常可以返回轴句柄。 - yuk