Matlab中使用不同颜色映射的子图

9

我正在尝试制作两个不同的等高线子图,它们使用完全不同的调色板。然而,使用我当前拥有的代码(为其中一个子图创建自定义调色板),子图会使用相同的调色板。有什么想法如何解决这个问题吗?

h = figure;
subplot(2,1,1)
title('GEFS 20 Member Mean Vorticity');
axesm('eqdcylin','maplonlimit',[-180 179],'maplatlimit',[0 90]);
%eqdcylin
contourm(gLat, gLon, squeeze(meanhx(x,:,:))', 16,'Color',[0.05 0.05 0.05],'LineWidth',2);
hold on
contourfm(gLat, gLon, squeeze(vmeanx(x,:,:))', 30, 'LineStyle', 'none'); 
shading flat;
lm=worldlo('POline');
  for i=1:length(lm);
  lm(i).otherproperty = {'color','m','LineWidth',1.5};
  end
displaym(lm);
gridm on;
tightmap;
set(h, 'Position', [1 1 2200 1100]);
colormap(b2r(-5*10^-5, 5*10^-5));
freezeColors;
cbfreeze(colorbar)


%caxis([-5*10^-5 5*10^-5])

colorbar;


subplot(2,1,2)
title('GEFS 20 Member Vorticity Variance');
axesm('eqdcylin','maplonlimit',[-180 179],'maplatlimit',[0 90]);
%eqdcylin
contourm(gLat, gLon, squeeze(meanhx(x,:,:))', 16,'Color',[0.05 0.05 0.05],'LineWidth',2);
hold on
contourfm(gLat, gLon, squeeze(vvarx(x,:,:))', 30, 'LineStyle', 'none'); 
shading flat;
lm=worldlo('POline');
  for i=1:length(lm);
  lm(i).otherproperty = {'color','m','LineWidth',1.5};
  end 
displaym(lm);
gridm on;
tightmap;
set(h, 'Position', [1 1 2200 1100]);

mycmap = [
0.9961    0.9961    0.9961;
0.6641    0.6641    0.9974;
0.3320    0.3320    0.9987;
     0         0    1.0000;
     0    0.2500    1.0000;
     0    0.5000    1.0000;
     0    0.7500    1.0000;
     0    1.0000    1.0000;
0.2000    1.0000    0.8000;
0.4000    1.0000    0.6000;
0.6000    1.0000    0.4000;
0.8000    1.0000    0.2000;
1.0000    1.0000         0;
1.0000    0.9333         0;
1.0000    0.8667         0;
1.0000    0.8000         0;
1.0000    0.7333         0;
1.0000    0.6667         0;
1.0000    0.6000         0;
1.0000    0.5333         0;
1.0000    0.4667         0;
1.0000    0.4000         0;
1.0000    0.3333         0;
1.0000    0.2667         0;
1.0000    0.2000         0;
1.0000    0.1333         0;
1.0000    0.0667         0;
1.0000         0         0;
0.9854         0         0;
0.9708         0         0;
0.9561         0         0;
0.9415         0         0;
0.9269         0         0;
0.9123         0         0;
0.8977         0         0;
0.8830         0         0;
0.8684         0         0;
0.8538         0         0;
0.8392         0         0;
0.8246         0         0;
0.8099         0         0;
0.7953         0         0;
0.7807         0         0;
0.7661         0         0;
0.7515         0         0;
0.7368         0         0;
0.7222         0         0;
0.7092         0         0;
0.6961         0         0;
0.6830         0         0;
0.6699         0         0;
0.6569         0         0;
0.6438         0         0;
0.6307         0         0;
0.6176         0         0;
0.6046         0         0;
0.5915         0         0;
0.5784         0         0;
0.5654         0         0;
0.5523         0         0;
0.5392         0         0;
0.5261         0         0;
0.5131         0         0;
0.5000         0         0;
];

colormap(mycmap);


freezeColors;
cbfreeze(colorbar);


set(gcf, 'renderer', 'zbuffer');
你提供的信息不足以最小化或重现问题;你是否已经仔细阅读了freezeColors中的示例? - rozsasarpi
当然可以,我该如何使其最小化且可重现呢? - agold2121
这篇文章与R有关,但同样适用于Matlab和任何编程问题。通过谷歌搜索可以得到成百上千条结果。此外,您还可以查看Stack Overflow的帮助文档 - rozsasarpi
我已经反复搜索了谷歌,但仍然无法找到直接解决这个问题的解决方案。否则我就不会在这里提问了。此外,我不确定是什么原因导致这个问题无法重现,因为没有任何东西是无法重现的,代码只是一个带有映射线的混乱的contourf图。 - agold2121
解决起来并不简单,可以在这里查看解决方案:http://stackoverflow.com/a/39741044/2627163 如果您能编写一个独立的代码让我运行,我会添加两个颜色映射。 - EBH
3个回答

3

编辑:看起来文档有误!请参见评论!

使用colormap函数的第二个参数,您可以将特定的颜色映射分配给特定的(子)图或轴,如果您想这样称呼它:

参考TMW:colormap

请注意,第一个参数是轴的句柄!

colormap(ax,map)

设置由ax指定的坐标轴的颜色映射。一个图中的每个坐标轴都可以有一个独特的颜色映射。设置坐标轴的颜色映射后,更改图的颜色映射不会影响坐标轴。

如何获取坐标轴的句柄?:

使用plot(x,y..)绘制时,将其作为返回值获取。通过以下方法捕获它:

ax = plot(x,y..)

对于其他绘图函数,就像你正在使用的那样,您应该在文档中找到有关它的一些信息。


这是错误的。问题是关于子图中的多个色图。上述方法仅适用于每个图在不同的图形中的情况。即使您获取了单个子图的轴句柄,设置其色图也会更改图形中所有其他轴的色图。 - carandraug
天啊,看来你是对的。我刚从文档中得到这个信息。我理解错了吗?->“每个图中的轴都可以有一个独特的颜色映射”,还是文档有问题..? :o - Lucius II.
1
显然是的。测试非常简单,data = randi (64, 10); hax1 = subplot (1, 2, 1); image (data); colormap (hax1, jet); hax2 = subplot (1, 2, 2); image (data); colormap (hax2, hot); Mathwork的解决方案是一个绝对的笑话。你必须创建一个颜色映射,将每个子图的颜色映射连接起来,并相应地调整每个子图上的值。如果你想要颜色条,你还需要手动设置它们的范围。 - carandraug

2

如果您升级到MATLAB 2017a,您可以使用语法colormap(axesHandle, cMap)为每个轴对象分配一个颜色映射。


0
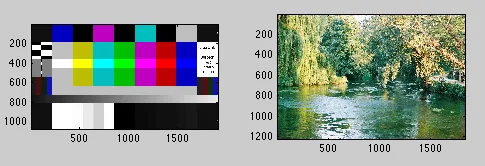
如果你有图像处理工具箱,你可以使用函数subimage来显示带有各自颜色映射的图像。
X1=imread('http://upload.wikimedia.org/wikipedia/commons/5/5c/Burosch_Blue-Only_Test_pattern.jpg');
X2=imread('http://upload.wikimedia.org/wikipedia/commons/e/ea/Romsey_River_Test.jpg');
subplot(1,2,1), subimage(X1)
subplot(1,2,2), subimage(X2)

结果:

two images in one figure

编辑:这个问题有一个更完整的答案在这里


我并没有加载图像,而是在计算contourf图。这个方法是否同样适用? - agold2121
@agold2121 我刚刚意识到它只适用于图像(即矩阵),请查看链接以了解如何使用绘图进行操作。 - Cape Code
@agold2121 freezeColors 没有解决你的问题吗? - Cape Code
不,它实际上将相同的颜色冻结到了两个子图中。 - agold2121

网页内容由stack overflow 提供, 点击上面的
可以查看英文原文,
原文链接