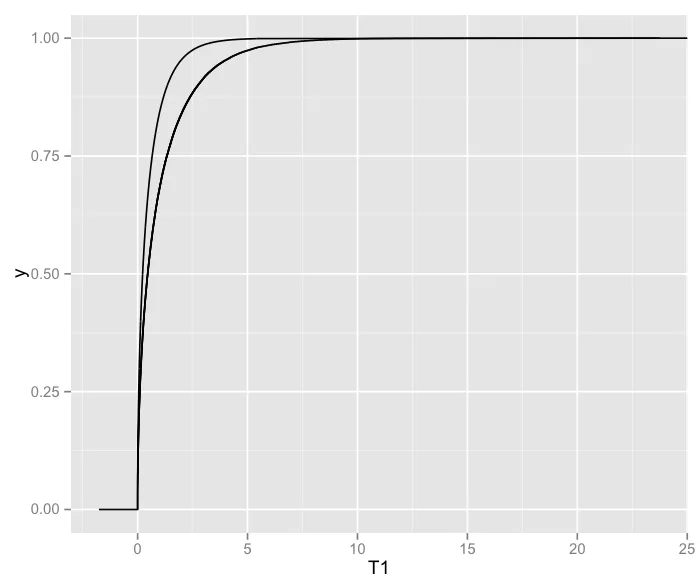
我刚接触ggplot2,现在想知道如何在已经创建的图表中添加一条线。原始图表是基于数据帧x的一列数据T1的累积分布,其中大约有100,000个元素。我已经成功使用ggplot2和stat_ecdf()绘制了这个图表,并发布了下面的代码。现在我想使用一组(x,y)坐标添加另一条线,但当我尝试使用geom_line()时,出现以下错误信息:
Error in data.frame(x = c(0, 7.85398574631245e-07, 3.14159923334398e-06,  :
arguments imply differing number of rows: 1001, 100000
这是我尝试使用的代码:
> set.seed(42)
> x <- data.frame(T1=rchisq(100000,1))
> ps <- seq(0,1,.001)
> ts <- .5*qchisq(ps,1) #50:50 mixture of chi-square (df=1) and 0
> p <- ggplot(x,aes(T1)) + stat_ecdf() + geom_line(aes(ts,ps))
这就是导致上述错误的原因。现在这是使用基础图形编写的代码,我曾经使用过,但现在正在尝试摆脱它:
plot(ecdf(x$T1),xlab="T1",ylab="Cum. Prob.",xlim=c(0,4),ylim=c(0,1),main="Empirical vs. Theoretical Distribution of T1")
lines(ts,ps)
我看到其他一些关于添加线的帖子,但我没有看到如何在两个起始向量长度不相同时添加线的方法。(注:我不想仅使用 100000(x,y)坐标。)
另外,是否有一种简单的方法,类似于使用abline 在 ggplot2 图表上添加垂直线?
非常感谢任何建议。