使用循环编写ggplot图表,使用不同的数据源和标题。

5

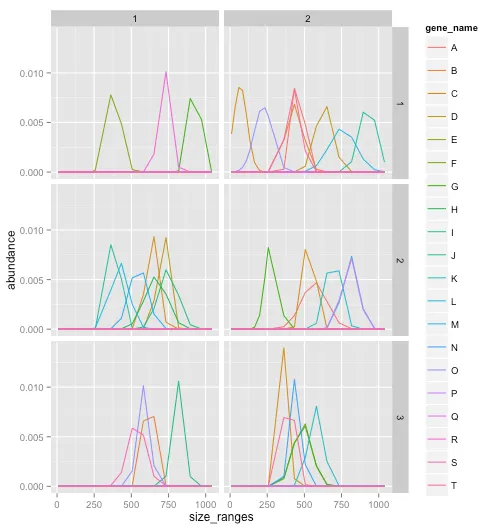
我没有循环的经验,但是看起来我需要创建一些循环来正确分析我的数据。您能否展示如何在我已经创建的代码中创建一个简单的循环?让我们使用循环来获得一些图表:

pdf(file = sprintf("complex I analysis", tbl_comp_abu1), paper='A4r')

ggplot(df_tbl_data1_comp1, aes(Size_Range, Abundance, group=factor(Gene_Name))) +
  theme(legend.title=element_blank()) +
  geom_line(aes(color=factor(Gene_Name))) +
  ggtitle("Data1 - complex I")+
  theme(axis.text.x = element_text(angle = 90, hjust = 1))

ggplot(df_tbl_data2_comp1, aes(Size_Range, Abundance, group=factor(Gene_Name))) +
  theme(legend.title=element_blank()) +
  geom_line(aes(color=factor(Gene_Name))) +
  ggtitle("Data2 - complex I")+
  theme(axis.text.x = element_text(angle = 90, hjust = 1))


ggplot(df_tbl_data3_comp1, aes(Size_Range, Abundance, group=factor(Gene_Name))) +
  theme(legend.title=element_blank()) +
  geom_line(aes(color=factor(Gene_Name))) +
  ggtitle("Datas3 - complex I")+
  theme(axis.text.x = element_text(angle = 90, hjust = 1))

dev.off()

现在的问题是我想要实现什么。首先,我有10个复合物要分析,这意味着需要创建10个pdf文件。示例展示了来自第一个复合物的三个不同数据集的图形。为了正确完成,变量comp1中的数字(来自df_tbl_dataX_comp1)必须从1更改为10-取决于我们想要绘制哪个复合物。下一个需要通过循环更改的事情是pdf文件的名称和每个图形...是否可能编写这样的循环?
数据:
structure(list(Size_Range = structure(c(1L, 1L, 1L, 2L, 2L, 2L, 
3L, 3L, 3L, 4L, 4L, 4L, 5L, 5L, 5L, 6L, 6L, 6L, 7L, 7L, 7L, 8L, 
8L, 8L, 9L, 9L, 9L, 10L, 10L, 10L, 11L, 11L, 11L, 12L, 12L, 12L, 
13L, 13L, 13L, 14L, 14L, 14L, 15L, 15L, 15L, 16L, 16L, 16L, 17L, 
17L, 17L, 18L, 18L, 18L, 19L, 19L, 19L, 20L, 20L, 20L), .Label = c("10", 
"34", "59", "84", "110", "134", "165", "199", "234", "257", "362", 
"433", "506", "581", "652", "733", "818", "896", "972", "1039"
), class = "factor"), Abundance = c(0, 0, 0, 0, 0, 0, 0, 0, 0, 
0, 0, 0, 0, 0, 0, 0, 0, 142733.475, 108263.525, 98261.11, 649286.165, 
3320759.803, 3708515.148, 6691260.945, 30946562.92, 180974.3725, 
4530005.805, 21499827.89, 0, 15032198.54, 4058060.583, 0, 3842964.97, 
2544030.857, 0, 1640476.977, 286249.1775, 0, 217388.5675, 1252965.433, 
0, 1314666.05, 167467.8825, 0, 253798.15, 107244.9925, 0, 207341.1925, 
15755.485, 0, 71015.85, 14828.5075, 0, 25966.2325, 0, 0, 0, 0, 
0, 0), Gene_Name = c("AT1G01080", "AT1G01090", "AT1G01320", "AT1G01420", 
"AT1G01470", "AT1G01560", "AT1G01800", "AT1G02150", "AT1G02500", 
"AT1G02560", "AT1G02780", "AT1G02880", "AT1G02920", "AT1G02930", 
"AT1G03030", "AT1G03090", "AT1G03110", "AT1G03130", "AT1G03220", 
"AT1G03230", "AT1G03330", "AT1G03475", "AT1G03630", "AT1G03680", 
"AT1G03870", "ATCG00420", "ATCG00470", "ATCG00480", "ATCG00490", 
"ATCG00500", "ATCG00650", "ATCG00660", "ATCG00670", "ATCG00740", 
"ATCG00750", "ATCG00842", "ATCG01100", "ATCG01030", "ATCG01114", 
"ATCG01665", "ATCG00770", "ATCG00780", "ATCG00800", "ATCG00810", 
"ATCG00820", "ATCG00722", "ATCG00744", "ATCG00855", "ATCG00853", 
"ATCG00888", "ATCG00733", "ATCG00766", "ATCG00812", "ATCG00821", 
"ATCG00856", "ATCG00830", "ATCG00900", "ATCG01060", "ATCG01110", 
"ATCG01120")), .Names = c("Size_Range", "Abundance", "Gene_Name"
), row.names = c(NA, -60L), class = "data.frame")

2
你可以查看以下链接:https://dev59.com/zX_aa4cB1Zd3GeqP1lKn 或 https://dev59.com/F2gu5IYBdhLWcg3wYWNX?rq=1 - Iris
你的数据很大吗?你可以考虑创建一个命名的数据框列表(甚至只有一个大的数据框),并使用lapply或类似的东西。 - Heroka
它们并不是很大。如果我知道如何做,那就很容易了... - Shaxi Liver
另一种方法(如果在不同文件中设置图表不是必需的)是将不同的图表保存到一个列表中,然后将该列表写入单个pdf文件,这样每个图形都会有一个页面。p = as.list(1:3)p[[1]] = ggplot(...) + ...p[[2]] = ... 然后 pdf("plots.pdf", paper = "A4r"); p; dev.off() - Akhil Nair
3个回答

4
这样可能会奏效: 启动两个循环,一个用于复杂迭代,另一个用于数据集迭代。然后使用paste0()paste()生成正确的文件名和标题。 PS:我没有测试代码,因为我没有你的数据。但这应该能给你一个思路。
#loop over complex    
for (c in 1:10) {

    #create pdf for every complex 
    pdf(file = paste0("complex", c, "analysis.pdf"), paper='A4r')

    #loop over datasets
    for(d in 1:3) {

    #plot
    ggplot(get(paste0("df_tbl_data",d,"_comp",c)), aes(Size_Range, Abundance, group=factor(Gene_Name))) +
      theme(legend.title=element_blank()) +
      geom_line(aes(color=factor(Gene_Name))) +
      ggtitle(paste0("Data",d," - complex ",c))+
      theme(axis.text.x = element_text(angle = 90, hjust = 1))
    }   
    dev.off()

}

它创建文件但没有任何扩展名(我的意思是没有“pdf”扩展名)。即使我手动更改为pdf,它也无法打开文件。 - Shaxi Liver
@ShaxiLiver,tbl_comp_abu1是什么? - maRtin
1
@ShaxiLiver 我做了一个小改动,希望现在可以工作了。我无法确定问题所在,因为我没有你的数据。有出现任何错误信息吗? - maRtin
1
在你的循环中使用ggsave不是最容易的吗?你必须给你的图形一个名称。这对我的图形非常有效。你可以像这样放置一些东西:ggsave(filename=paste("complex",c,"analysis.pdf",sep=""), plot=myplot) - Marinka
3
尝试将ggplot行用一个print语句括起来。 - jMathew
显示剩余3条评论

2
所以在回答后,我意识到它并没有解决关于循环的实际问题。然而,我希望它能展示一种不同的解决方法来解决你的根本问题(也就是说,我不想让我的工作付之东流)。
我无法使用你发布的数据使图表正常工作。在一个具有60行的数据框中有60个唯一基因名。当您尝试制作 geom_line 并按基因分组( aes(group = Gene_name))时,每条线只有一个点。 您需要两个点才能画出一条线。
我编造了一些数据并进行了分析。
# Function to generate random data
generate_data = function() {
  require(truncnorm)
  require(dplyr)

  gene_names = LETTERS[1:20]
  n_genes = length(gene_names)
  size_ranges = c(10, 34, 59, 84, 110, 134, 165, 199, 
                  234, 257, 362, 433, 506, 581, 652, 
                  733, 818, 896, 972, 1039)
  gene_size_means = rtruncnorm(n_genes, 10, 1000, 550, 300)
  genes_in_complex = rbinom(n_genes, 1, 0.3)
  true_variance = 50
  gene_size_variances = rchisq(n_genes, n_genes-1) * (true_variance/(n_genes-1))
  df = data.frame(gene_name=gene_names, 
                  gene_mean=gene_size_means, 
                  gene_var=gene_size_variances,
                  in_complex=genes_in_complex)
  df = df %>% group_by(gene_name) %>% 
    do(data.frame(size_ranges, 
                  abundance=dnorm(size_ranges, .$gene_mean, .$gene_var)*.$in_complex))
  return(df)
}

# Generate a list of tables. Each table is for one data set for one complex
data_tables = list()
n_comps = 3
for( complex_i in 1:2 ) {
  for( comp_j in 1:n_comps ) {
    loop_df = generate_data()
    loop_df$comp = comp_j
    loop_df$complex = complex_i
    data_tables = c(data_tables, list(loop_df))
  }
}

# Concatenate the tables into a larger data frame
dat = do.call(rbind, data_tables)

# Make a plots for each data set for complex 1
dat_complex1 = subset(dat, complex==1)
p = ggplot(dat_complex1, aes(x=size_ranges, y=abundance, color=gene_name, group=gene_name)) +
  geom_line() + 
  facet_wrap(~comp, ncol=1)
print(p)

# Make a plot with many subpanels for all complexes and data sets
p %+% dat + facet_grid(comp~complex) # screenshot shown below

enter image description here

所以你在研究拟南芥中的蛋白质复合物?如果有人熟悉你的领域,提供一句背景信息可能会帮助他们回答你的问题。或者,提供期望输出的图片也可能会有所帮助。此外,提供更完整的示例数据和/或屏幕截图可能会增加你未来帖子的吸引力。

1
请看这个方法。它依赖于一个包含数据集名称、图表标题和文件名的 data.frame(dat)。
首先,我创建了一个函数来创建并保存绘图,然后在 for 循环和 apply 循环中调用该函数(尽可能使用 apply,它更快)。
代码如下:
# create a custom function for ggplot, 
# which creates the plot and then saves it as a pdf
custom_ggplot_function <- function(input.data.name, graph.title, f.name){
  # get(input.data.name) gets you the variable which is stored as a string in
  # input.data.name

  p <- ggplot(get(input.data.name), aes(Size_Range, Abundance, group=factor(Gene_Name))) +
    theme(legend.title=element_blank()) +
    geom_line(aes(color=factor(Gene_Name))) +
    ggtitle(graph.title)+
    theme(axis.text.x = element_text(angle = 90, hjust = 1))

  ggsave(filename = paste0(f.name, ".pdf"), plot = p)
  NULL
}

# dat contains the names of your datasets, the titles of the graphs and filenames
dat <- data.frame(df.names = c("df_tbl_data1_comp1",
                              "df_tbl_data2_comp1"),
                  graph.titles = c("Data1 - Complex I",
                                   "Data2 - Complex II"),
                  file.names = c("file1", "file2"))
# If you create your data.frame dat, you can also say 
# df.names  = paste0("df_tbl_data", 1:10, "_comp1") and
# graph.titles = paste0("Data", 1:10, " - Complex ", 1:10)     


# loop through the rows of dat
for (i in 1:nrow(dat)) {
  custom_ggplot_function(input.data.name = dat[i, "df.names"],
                         graph.title = dat[i, "graph.titles"], 
                         f.name = dat[i, "file.names"])
}

# or using the apply function
apply(dat, 1, function(row.el) {
  custom_ggplot_function(input.data.name = row.el["df.names"], 
                         graph.title = row.el["graph.titles"], 
                         f.name = row.el["file.names"])
})

网页内容由stack overflow 提供, 点击上面的
可以查看英文原文,
原文链接