我该如何在Python中创建类似以下代码示例的径向聚类?

14
我发现了一些创建类似(至少我认为是这样)以下示例的层次结构的方法,例如在这里stackoverflow.com/questions/2982929/,它们效果很好,几乎实现了我要找的功能。

[编辑] 这里是Paul代码的简化版本,相对于当前的聚类形状,现在应该更容易将其转换为径向聚类。

正确的结构,错误的显示——需要成为一个径向集群

import scipy
import pylab
import scipy.cluster.hierarchy as sch

def fix_verts(ax, orient=1):
    for coll in ax.collections:
        for pth in coll.get_paths():
            vert = pth.vertices
            vert[1:3,orient] = scipy.average(vert[1:3,orient]) 

# Generate random features and distance matrix.
x = scipy.rand(40)
D = scipy.zeros([40,40])
for i in range(40):
    for j in range(40):
        D[i,j] = abs(x[i] - x[j])

fig = pylab.figure(figsize=(8,8))

# Compute and plot the dendrogram.
ax2 = fig.add_axes([0.3,0.71,0.6,0.2])
Y = sch.linkage(D, method='single')
Z2 = sch.dendrogram(Y)
ax2.set_xticks([])
ax2.set_yticks([])

fix_verts(ax2,0)
fig.savefig('test.png')

但是我需要一个类似于以下示意图的径向集群,而不是树形结构。

输入图像说明 径向集群1


你的代码示例生成了线性轴的树状图。你的图像示例有一个环形轴。我不清楚你是想在箱线图上获得径向图中发现的“Y”形分支,还是想复制径向图。 - Paul
看一下这个例子:http://matplotlib.sourceforge.net/examples/axes_grid/demo_floating_axes.html。必须有一种方法可以应用变换到这个直角坐标图上,以得到你想要的结果。我今天早上花了一点时间研究它,但没有成功。 - Paul
6个回答

8

不幸的是,在pos=nx.graphviz_layout(G,prog='twopi',args='')这一行上,代码完全出错了。然而,导入似乎工作得很好。根据版本,我有nx.version 1.0rc1(networkx版本1.0rc1)。 - T Carrasco
1
我认为问题在于您需要单独安装GraphViz,因为当我运行示例代码时遇到的特定错误是:“InvocationException:找不到GraphViz的可执行文件”,但理论上,如果您拥有所有必要的组件,则此代码应该实现您想要的功能。请参见http://networkx.lanl.gov/install.html以获取包括GraphViz在内的可选软件包的链接。 - JoshAdel
需要单独安装它,就可以了。用它创建上面的示例很方便,但是我不想要平衡树,我的示例展示了一棵不平衡的树,其中随机节点之间有连接。第一个示例最能说明这一点。请问networkx是否支持这种情况? - T Carrasco
平衡树仅用于示例以展示networkx的绘图能力,特别是循环图布局。这里有许多经典图形生成器:http://networkx.lanl.gov/reference/generators.html,包括随机图。您可以使用其中之一,或使用package图元素创建自己的自定义网络/图形。 - JoshAdel
1
这里有一个替代链接:https://networkx.github.io/documentation/networkx-1.9/examples/drawing/circular_tree.html - Jarad
显示剩余2条评论

8

我已经更深入地研究了这个问题,现在似乎最好的方法是直接从链接输出中创建一个新的函数来绘制径向聚类(而不是修改已有绘图)。我可能会尝试一些东西,但不会很快。

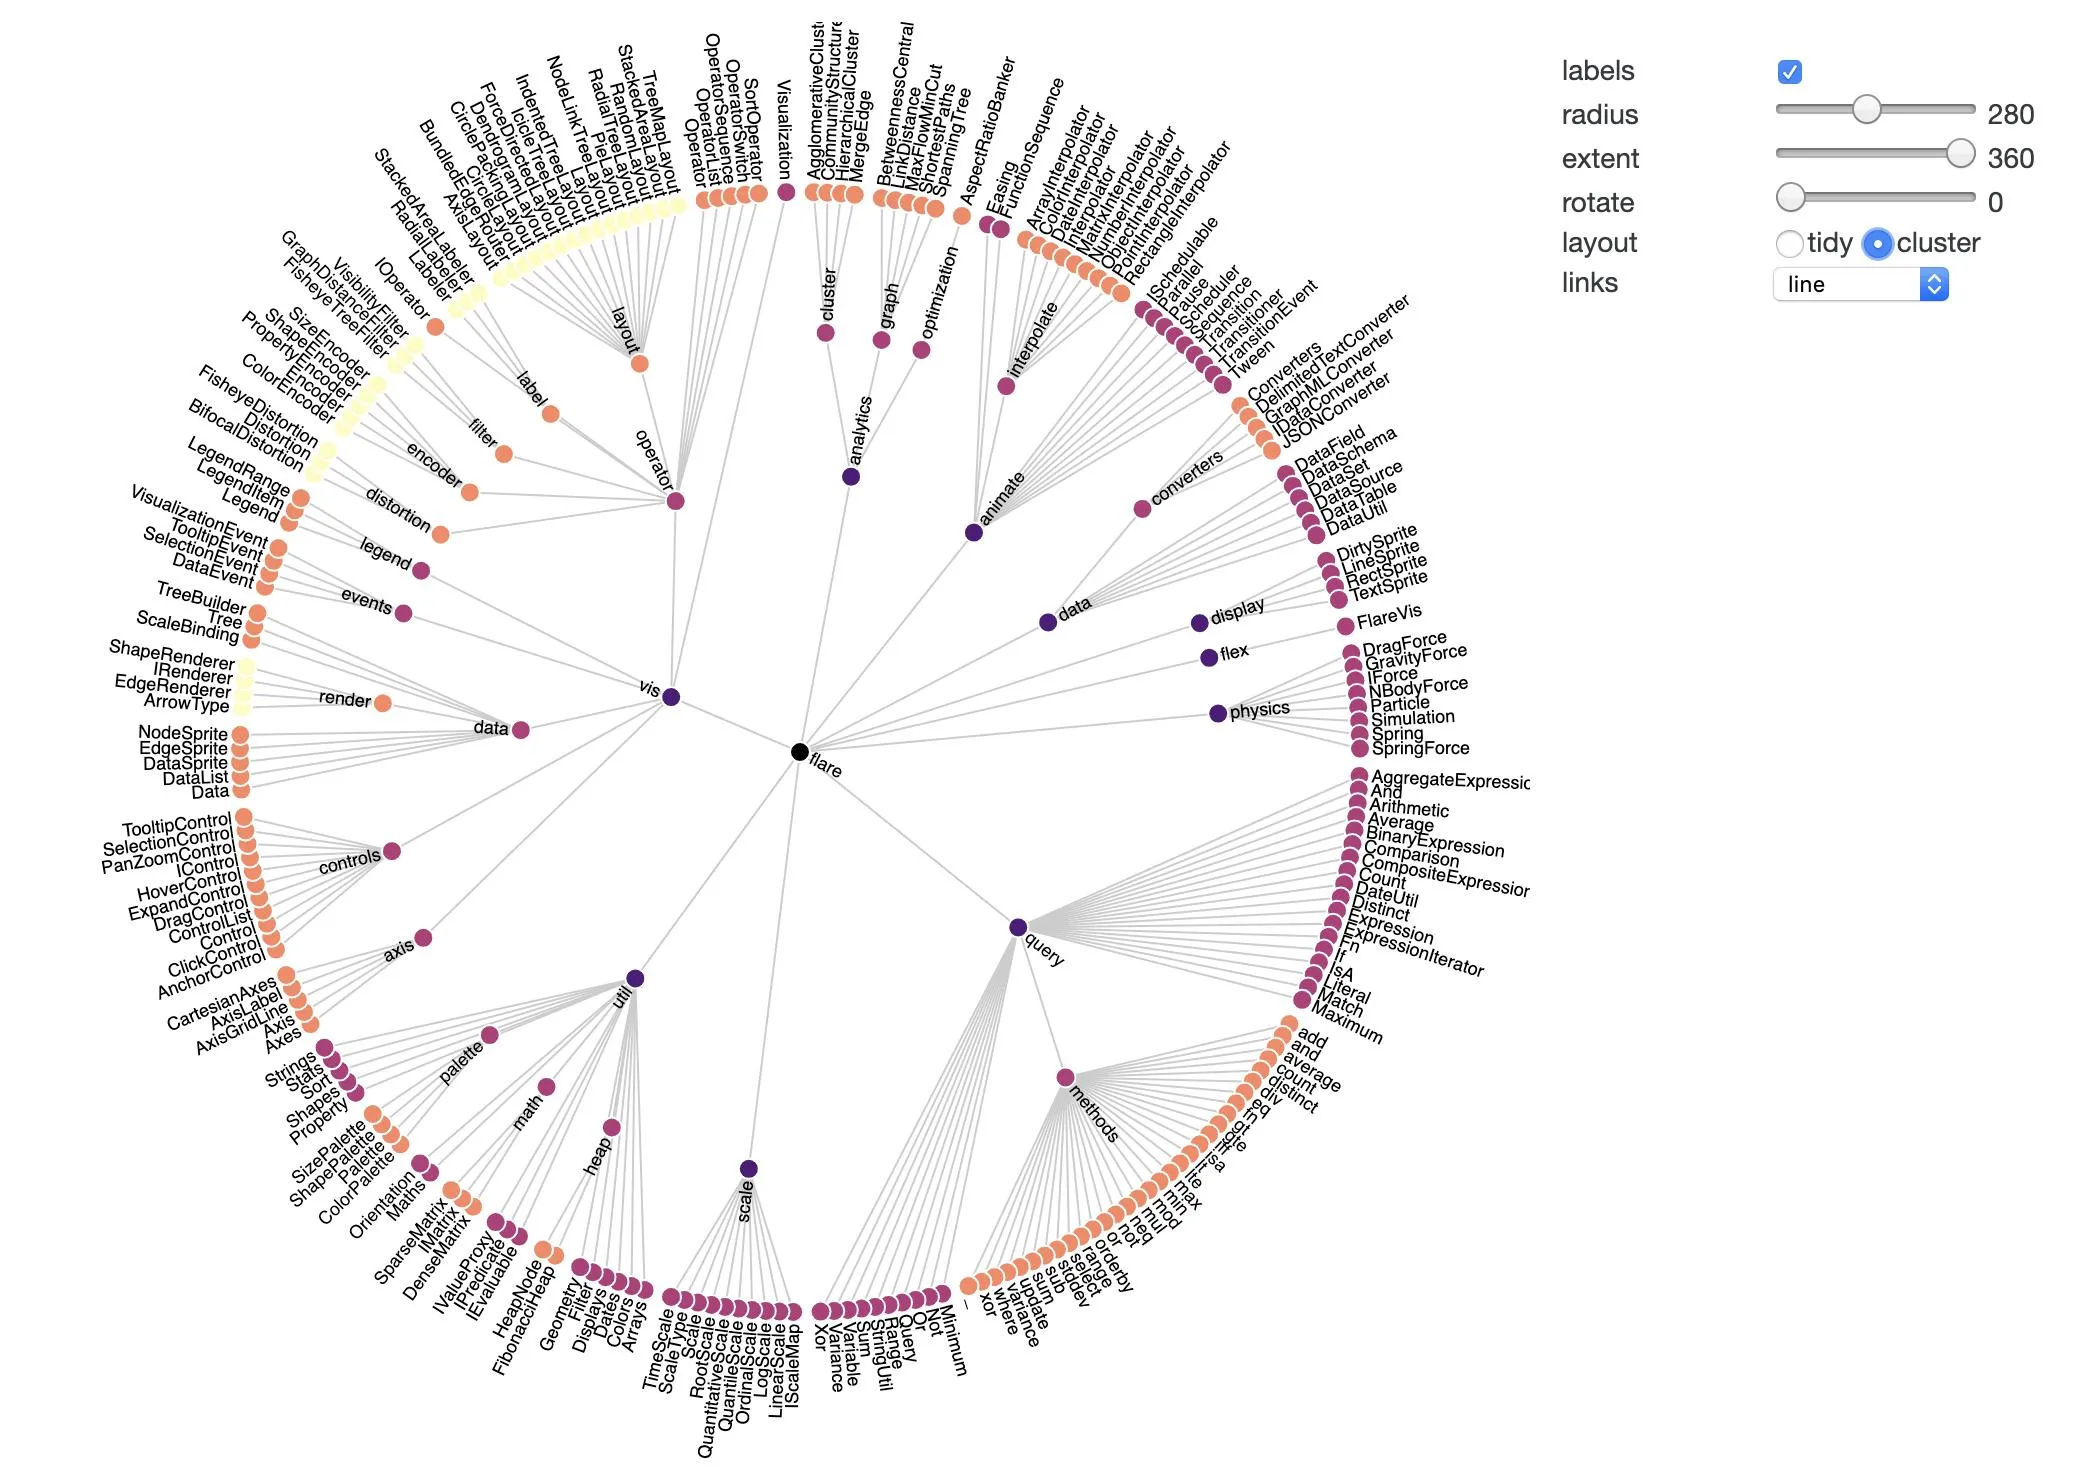
我假设您的数据自然适合这种径向嵌入。您是否已经验证过?linkage 中存在适合您目的的合适方法吗?

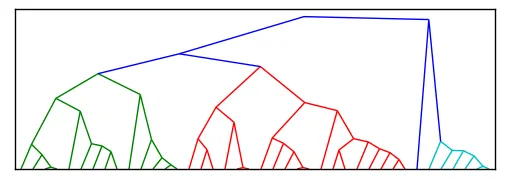
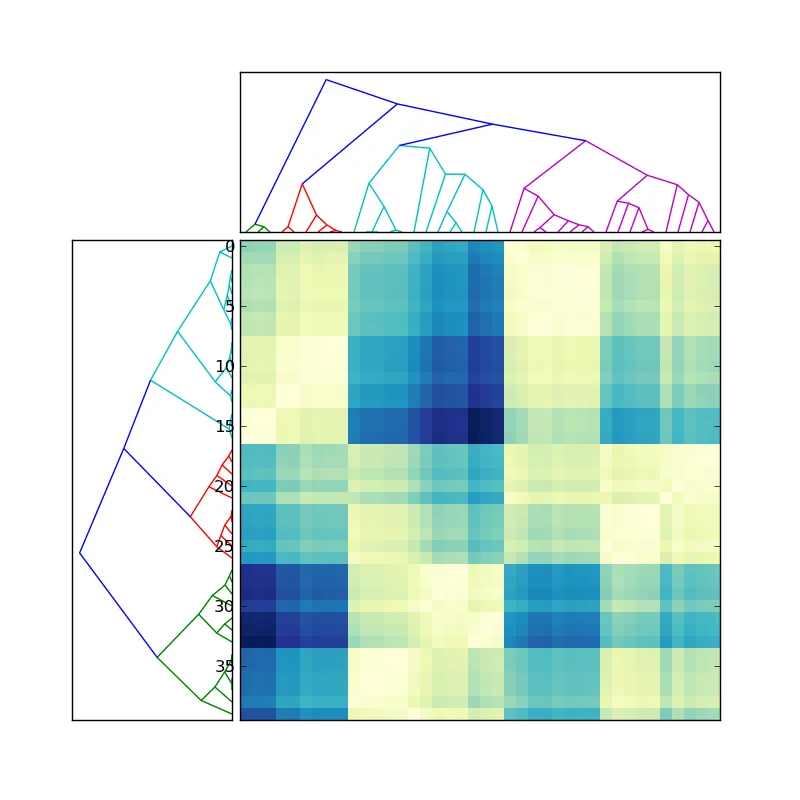
似乎对于任何方法,linkage 都会返回二叉树结构。在您的示例中,您拥有更通用的树。您需要一些额外的知识来合并树节点。这已经使修改原始树状图的想法失效了。

更新:
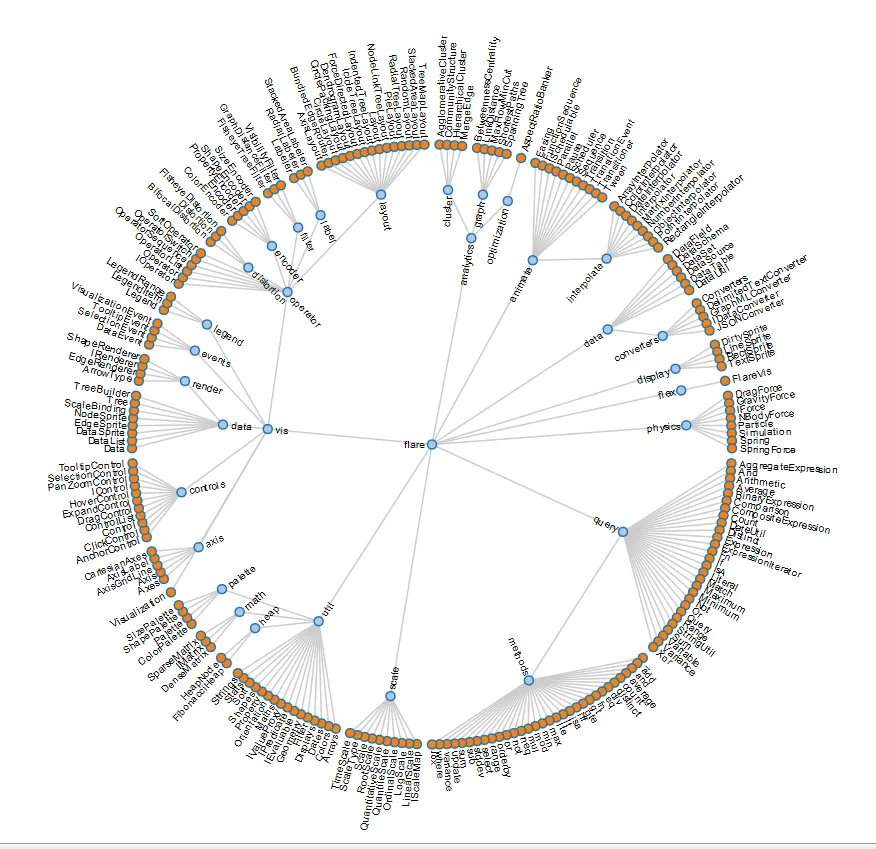
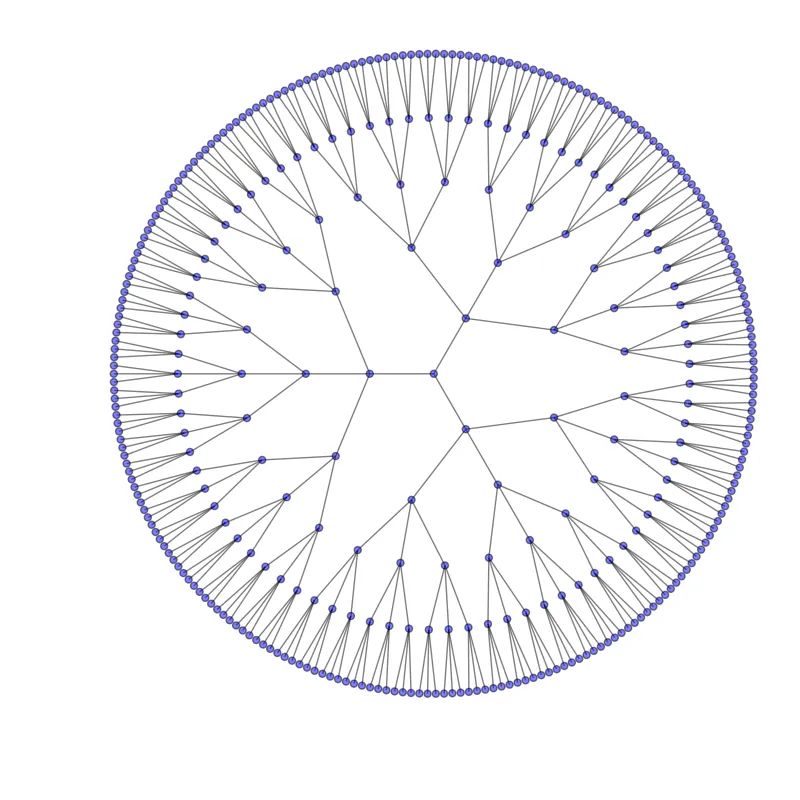
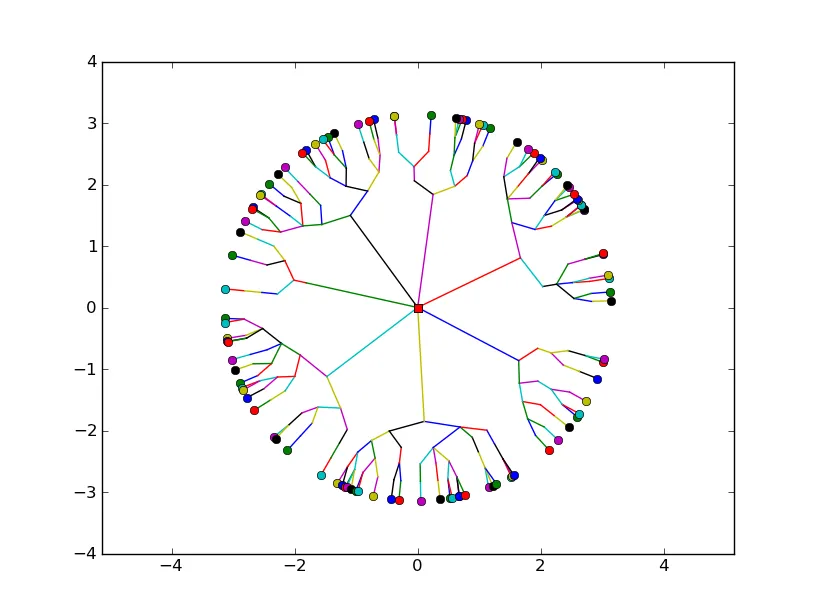
如果这个简单的示例绘图对您的目的来说足够相似,那么我将能够发布一些非常简单的代码来实现它。 "Radial dendrogram"

更新 2:

以下是代码:

radial_demo.py:

from numpy import r_, ones, pi, sort
from numpy.random import rand
from radial_grouper import tree, pre_order, post_order
from radial_visualizer import simple_link
from pylab import axis, figure, plot, subplot

# ToDo: create proper documentation
def _s(sp, t, o):
    subplot(sp)
    t.traverse(simple_link, order= o)
    axis('equal')

def demo1(n):
    p= r_[2* pi* rand(1, n)- pi, ones((1, n))]
    t= tree(p)
    f= figure()
    _s(221, t, pre_order)
    _s(222, t, post_order)
    t= tree(p, tols= sort(2e0* rand(9)))
    _s(223, t, pre_order)
    _s(224, t, post_order)
    f.show()
    # f.savefig('test.png')

# ToDO: implement more demos

if __name__ == '__main__':
    demo1(123)

radial_grouper.py:

"""All grouping functionality is collected here."""
from collections import namedtuple
from numpy import r_, arange, argsort, array, ones, pi, where
from numpy import logical_and as land
from radial_support import from_polar

__all__= ['tree', 'pre_order', 'post_order']

Node= namedtuple('Node', 'ndx lnk')

# ToDo: enhance documentation
def _groub_by(p, tol, r):
    g, gm, gp= [], [], p- p[0]
    while True:
        if gp[-1]< 0: break
        ndx= where(land(0.<= gp, gp< tol))[0]
        if 0< len(ndx):
            g.append(ndx)
            gm.append(p[ndx].mean())
        gp-= tol
    return g, array([gm, [r]* len(gm)])

def _leafs(p):
    return argsort(p[0])

def _create_leaf_nodes(ndx):
    nodes= []
    for k in xrange(len(ndx)):
        nodes.append(Node(ndx[k], []))
    return nodes

def _link_and_create_nodes(_n, n_, cn, groups):
    nodes, n0= [], 0
    for k in xrange(len(groups)):
        nodes.append(Node(n_+ n0, [cn[m] for m in groups[k]]))
        n0+= 1
    return n_, n_+ n0, nodes

def _process_level(nodes, polar, p, tol, scale, _n, n_):
    groups, p= _groub_by(p, tol, scale* polar[1, _n])
    _n, n_, nodes= _link_and_create_nodes(_n, n_, nodes, groups)
    polar[:, _n: n_]= p
    return nodes, polar, _n, n_

def _create_tree(p, r0, scale, tols):
    if None is tols:
        tols= .3* pi/ 2** arange(5)[::-1]
    _n, n_= 0, p.shape[1]
    polar= ones((2, (len(tols)+ 2)* n_))
    polar[0, :n_], polar[1, :n_]= p[0], r0
    # leafs
    nodes= _create_leaf_nodes(_leafs(p))
    nodes, polar, _n, n_= _process_level(
    nodes, polar, polar[0, _leafs(p)], tols[0], scale, _n, n_)
    # links
    for tol in tols[1:]:
        nodes, polar, _n, n_= _process_level(
        nodes, polar, polar[0, _n: n_], tol, scale, _n, n_)
    # root
    polar[:, n_]= [0., 0.]
    return Node(n_, nodes), polar[:, :n_+ 1]

def _simplify(self):
    # ToDo: combine single linkages
    return self._root

def _call(self, node0, node1, f, level):
    f(self, [node0.ndx, node1.ndx], level)

def pre_order(self, node0, f, level= 0):
    for node1 in node0.lnk:
        _call(self, node0, node1, f, level)
        pre_order(self, node1, f, level+ 1)

def post_order(self, node0, f, level= 0):
    for node1 in node0.lnk:
        post_order(self, node1, f, level+ 1)
        _call(self, node0, node1, f, level)

class tree(object):
    def __init__(self, p, r0= pi, scale= .9, tols= None):
        self._n= p.shape[1]
        self._root, self._p= _create_tree(p, r0, scale, tols)

    def traverse(self, f, order= pre_order, cs= 'Cartesian'):
        self.points= self._p
        if cs is 'Cartesian':
            self.points= from_polar(self._p)
        order(self, self._root, f, 0)
        return self

    def simplify(self):
        self._root= _simplify(self)
        return self

    def is_root(self, ndx):
        return ndx== self._p.shape[1]- 1

    def is_leaf(self, ndx):
        return ndx< self._n

if __name__ == '__main__':
    # ToDO: add tests
    from numpy import r_, round
    from numpy.random import rand
    from pylab import plot, show

    def _l(t, n, l):
        # print round(a, 3), n, l, t.is_root(n[0]), t.is_leaf(n[1])
        plot(t.points[0, n], t.points[1, n])
        if 0== l:
            plot(t.points[0, n[0]], t.points[1, n[0]], 's')
        if t.is_leaf(n[1]):
            plot(t.points[0, n[1]], t.points[1, n[1]], 'o')

    n= 123
    p= r_[2* pi* rand(1, n)- pi, ones((1, n))]
    t= tree(p).simplify().traverse(_l)
    # t= tree(p).traverse(_l, cs= 'Polar')
    show()
    # print
    # t.traverse(_l, post_order, cs= 'Polar')

radial_support.py:

"""All supporting functionality is collected here."""
from numpy import r_, arctan2, cos, sin
from numpy import atleast_2d as a2d

# ToDo: create proper documentation strings
def _a(a0, a1):
    return r_[a2d(a0), a2d(a1)]

def from_polar(p):
    """(theta, radius) to (x, y)."""
    return _a(cos(p[0])* p[1], sin(p[0])* p[1])

def to_polar(c):
    """(x, y) to (theta, radius)."""
    return _a(arctan2(c[1], c[0]), (c** 2).sum(0)** .5)

def d_to_polar(D):
    """Distance matrix to (theta, radius)."""
    # this functionality is to adopt for more general situations
    # intended functionality:
    # - embedd distance matrix to 2D
    # - return that embedding in polar coordinates
    pass

if __name__ == '__main__':
    from numpy import allclose
    from numpy.random import randn
    c= randn(2, 5)
    assert(allclose(c, from_polar(to_polar(c))))

    # ToDO: implement more tests

radial_visualizer.py:

"""All visualization functionality is collected here."""
from pylab import plot

# ToDo: create proper documentation
def simple_link(t, ndx, level):
    """Simple_link is just a minimal example to demonstrate what can be
    achieved when it's called from _grouper.tree.traverse for each link.
    - t, tree instance
    - ndx, a pair of (from, to) indicies
    - level, of from, i.e. root is in level 0
    """
    plot(t.points[0, ndx], t.points[1, ndx])
    if 0== level:
        plot(t.points[0, ndx[0]], t.points[1, ndx[0]], 's')
    if t.is_leaf(ndx[1]):
        plot(t.points[0, ndx[1]], t.points[1, ndx[1]], 'o')

# ToDO: implement more suitable link visualizers
# No doubt, this will the part to burn most of the dev. resources

if __name__ == '__main__':
    # ToDO: implement tests
    pass

您可以在这里找到源代码。请随意修改它,但请确保将未来的修改与该要点同步。

我猜不清楚为什么人们不应该选择 networkx 解决方案,除非他们真的想要重新发明轮子并且有一种不需要额外依赖的方法。GraphViz 是专门为此目的设计的强大工具。 - JoshAdel
网络X的解决方案很好,如果您能描述如何使用其术语从所描述的“平衡树”G=nx.balanced_tree(3,5)转换为非平衡树。我有一个示例图片可以很好地展示这一点,即并非所有叶节点都具有相同的计数~ - T Carrasco
@Morvern -- 请查看我在原回答中附加的评论,了解如何在networkx中创建unbalanced_tree。 - JoshAdel
@Morvern:我已经更新了我的答案,并附上了源代码的位置。谢谢。 - eat

6
我新增了一个名为fix_verts的函数,它可以合并树状图中每个“U”形之底部的顶点。

试一试:

import scipy
import pylab
import scipy.cluster.hierarchy as sch

def fix_verts(ax, orient=1):
    for coll in ax.collections:
        for pth in coll.get_paths():
            vert = pth.vertices
            vert[1:3,orient] = scipy.average(vert[1:3,orient]) 

# Generate random features and distance matrix.
x = scipy.rand(40)
D = scipy.zeros([40,40])
for i in range(40):
    for j in range(40):
        D[i,j] = abs(x[i] - x[j])


fig = pylab.figure(figsize=(8,8))

# Compute and plot first dendrogram.
ax1 = fig.add_axes([0.09,0.1,0.2,0.6])
Y = sch.linkage(D, method='centroid')
Z1 = sch.dendrogram(Y, orientation='right')
ax1.set_xticks([])
ax1.set_yticks([])

# Compute and plot second dendrogram.
ax2 = fig.add_axes([0.3,0.71,0.6,0.2])
Y = sch.linkage(D, method='single')
Z2 = sch.dendrogram(Y)
ax2.set_xticks([])
ax2.set_yticks([])

# Plot distance matrix.
axmatrix = fig.add_axes([0.3,0.1,0.6,0.6])
idx1 = Z1['leaves']
idx2 = Z2['leaves']
D = D[idx1,:]
D = D[:,idx2]
im = axmatrix.matshow(D, aspect='auto', origin='lower', cmap=pylab.cm.YlGnBu)
axmatrix.set_xticks([])
fix_verts(ax1,1)
fix_verts(ax2,0)
fig.savefig('test.png')

结果如下所示: 在此输入图片描述
我希望这正是您想要的。

3
有趣,但它看起来并不像OP提供的任何一张图片... - JoshAdel
我使用了你的代码来编辑这篇文章,基于你的代码简化版本(因为只使用一个树,所以没有必要进行奇怪的平铺操作和两个树的处理)。 - T Carrasco

6
Vega有一个与您的第一张图表非常相似的示例,涉及it技术。您可以在他们的在线编辑器上体验它,这非常酷并且易于使用。

Vega示例与您的第一张图表非常相似。

enter image description here


这是一个JS库,不是Python库。 - Nicolas

1

最近,我创建了一个小型的Python模块(https://github.com/koonimaru/radialtree),用于从scipy树状图输出绘制圆形树状图。

以下是如何使用它的示例:

import scipy.cluster.hierarchy as sch
import numpy as np
import radialtree as rt

np.random.seed(1)
labels=[chr(i)*10 for i in range(97, 97+numleaf)]
x = np.random.rand(numleaf)
D = np.zeros([numleaf,numleaf])
for i in range(numleaf):
    for j in range(numleaf):
        D[i,j] = abs(x[i] - x[j])

Y = sch.linkage(D, method='single')
Z2 = sch.dendrogram(Y,labels=labels)
rt.plot(Z2)

1

这些径向树可以使用Graphviz创建。

通常,在网络中节点的位置并不重要。这就是为什么我们可以使用D3.js在任何可视化中拖动节点的原因。尽管如此,节点的位置对于可视化仍然很重要。 当在NetworkX中绘制网络时,我们需要为节点分配位置。

通常通过在调用方法nx.draw_networkx()时传递pos属性来实现。可以使用在nx.drawing.layout()中指定的任何布局确定pos属性(节点位置)。

径向树可以通过使用Graphviz的nx.nx_agraph.graphviz_layout()创建。与prog='dot'不同,您必须使用prog='twopi'来进行径向布局
可执行代码块在此处:
import networkx as nx
import matplotlib.pyplot as plt

plt.figure(figsize=(12,12))
pos = nx.nx_agraph.graphviz_layout(G, prog='twopi', root='0') ##Needs graphviz
nx.draw_networkx(G, pos=pos, 
                 with_labels=False, node_size=0.5,
                 edge_color='lightgray',
                 node_color='gray') 
plt.show()

注意:您需要在环境中安装graphviz库。否则,graphviz_layout()方法将无法工作。G必须是一棵树。在调用graphviz_layout()方法时,您需要指定根节点。

示例结果:

Radial Tree using Graphviz with Networkx


网页内容由stack overflow 提供, 点击上面的
可以查看英文原文,
原文链接