2个回答
32
你的意思是这样吗? 很抱歉,我不懂HTML5画布,只了解R语言...但希望对你有所帮助...
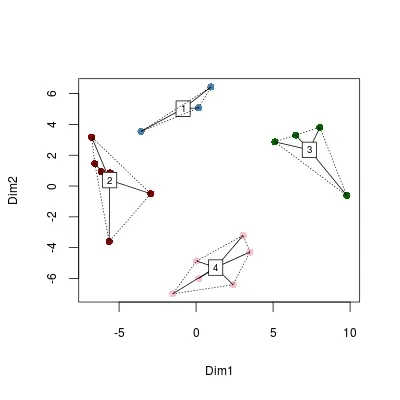
首先,我使用kmeans对数据进行聚类(请注意,我没有对距离矩阵进行聚类),然后计算距离矩阵并使用cmdscale绘制它。然后,我添加颜色到MDS图,这些颜色对应于kmeans识别出来的组。再加上一些漂亮的额外图形特征。
你可以从由cmdscale创建的对象中访问坐标。
### some sample data
require(vegan)
data(dune)

# kmeans
kclus <- kmeans(dune,centers= 4, iter.max=1000, nstart=10000)

# distance matrix
dune_dist <- dist(dune)

# Multidimensional scaling
cmd <- cmdscale(dune_dist)

# plot MDS, with colors by groups from kmeans
groups <- levels(factor(kclus$cluster))
ordiplot(cmd, type = "n")
cols <- c("steelblue", "darkred", "darkgreen", "pink")
for(i in seq_along(groups)){
  points(cmd[factor(kclus$cluster) == groups[i], ], col = cols[i], pch = 16)
}

# add spider and hull
ordispider(cmd, factor(kclus$cluster), label = TRUE)
ordihull(cmd, factor(kclus$cluster), lty = "dotted")
- EDi
3
1谢谢@EDi,这真的很棒。所以,为了澄清一下,您首先进行聚类,然后构建相似度矩阵。然后使用MDS将点定位到2D,然后通过它们与聚类的关系来着色点。太棒了。如果您有机会,能否解释一下这是做什么的:groups <- levels(factor(kclus$cluster))。 - slotishtype
1groups只是一个包含组名的对象,仅用于for循环。 - EDi
好的,我看到你的编辑。最后一个问题,你能聚类距离矩阵吗,还是这个想法太过疯狂?抱歉,我现在还在学习,正在逐步解决问题。 - slotishtype
0
在这里,您可以找到一个图表来分析聚类结果,即“clusplot”包中的“坐标图”。
它不是基于PCA。它使用函数scale将所有变量的平均值缩放到0到1的范围内,因此您可以比较哪个聚类对于每个变量具有最大/最小平均值。
它不是基于PCA。它使用函数scale将所有变量的平均值缩放到0到1的范围内,因此您可以比较哪个聚类对于每个变量具有最大/最小平均值。
install.packages("devtools") ## To be able to download packages from github
library(devtools)
install_github("pablo14/clusplus")
library(clusplus)

## Create k-means model with 3 clusters
fit_mtcars=kmeans(mtcars,3)

## Call the function
plot_clus_coord(fit_mtcars, mtcars)
这篇文章解释了如何使用它。
- Pablo Casas
网页内容由stack overflow 提供, 点击上面的可以查看英文原文,
原文链接
原文链接