如何在一个图中显示多个图片

146
我正在尝试在一个单独的图像上显示20个随机图片。这些图片确实被显示出来了,但是它们重叠在一起。我正在使用:
import numpy as np
import matplotlib.pyplot as plt
w=10
h=10
fig=plt.figure()
for i in range(1,20):
    img = np.random.randint(10, size=(h,w))
    fig.add_subplot(i,2,1)
    plt.imshow(img)
plt.show()

我希望它们以自然的方式呈现在一个网格布局中(例如4x5),每个大小相同。问题的一部分是我不知道add_subplot的参数意味着什么。文档说明参数是行数、列数和绘图编号,没有定位参数。此外,绘图编号只能为1或2。我该如何实现这个目标?


2
虽然从技术上讲这个问题是一个重复的问题,但是这个问题的浏览量比另一个问题高了大约10倍。 - Justas
@Justas 谷歌的方式是神秘的。 - gboffi
@gboffi 或者也许我是一个SEO专家 ;) - bkr879
虽然在单个窗口中显示多个图形的方法较旧,但答案并不更好。 - Trenton McKinney
2个回答

327

以下是我的建议,你可以尝试一下:

import numpy as np
import matplotlib.pyplot as plt

w = 10
h = 10
fig = plt.figure(figsize=(8, 8))
columns = 4
rows = 5
for i in range(1, columns*rows +1):
    img = np.random.randint(10, size=(h,w))
    fig.add_subplot(rows, columns, i)
    plt.imshow(img)
plt.show()

生成的图像:

output_image

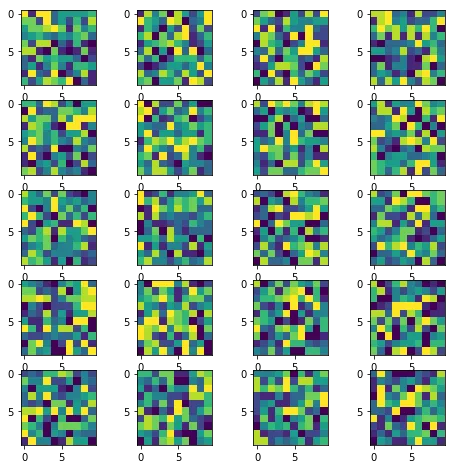
(原回答日期:2017年10月7日 4:20)

编辑1

由于这个答案比我预期的受欢迎,我发现需要进行一些小改变,以便能够灵活操纵各个子图的特征。因此,我向原始代码提供了这个新版本。 实质上,它提供了以下内容:

  1. 访问子图中各个轴的功能
  2. 在选择的轴/子图上绘制更多特征的可能性

新代码:

import numpy as np
import matplotlib.pyplot as plt

w = 10
h = 10
fig = plt.figure(figsize=(9, 13))
columns = 4
rows = 5

# prep (x,y) for extra plotting
xs = np.linspace(0, 2*np.pi, 60)  # from 0 to 2pi
ys = np.abs(np.sin(xs))           # absolute of sine

# ax enables access to manipulate each of subplots
ax = []

for i in range(columns*rows):
    img = np.random.randint(10, size=(h,w))
    # create subplot and append to ax
    ax.append( fig.add_subplot(rows, columns, i+1) )
    ax[-1].set_title("ax:"+str(i))  # set title
    plt.imshow(img, alpha=0.25)

# do extra plots on selected axes/subplots
# note: index starts with 0
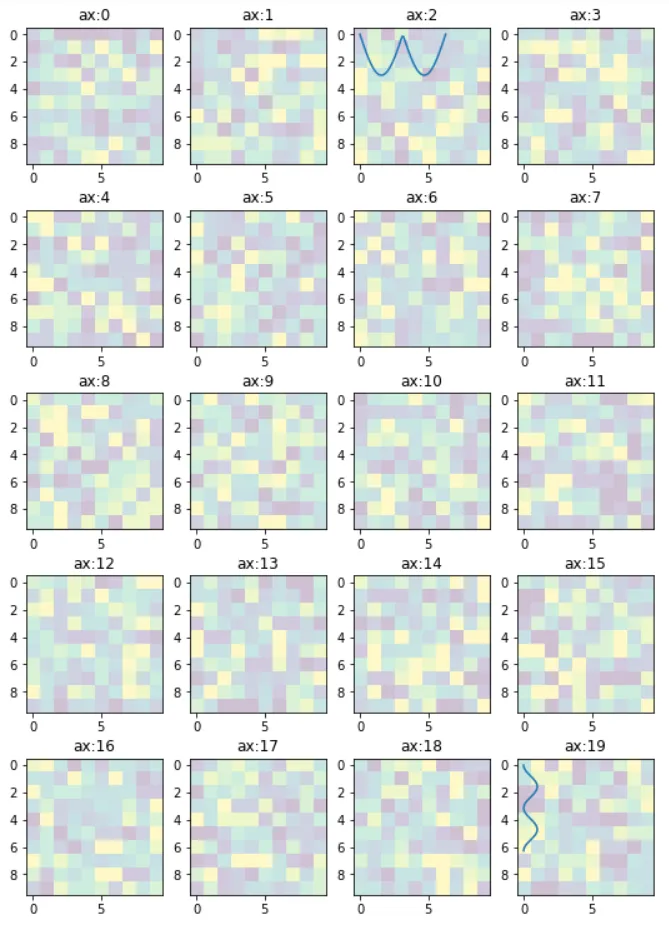
ax[2].plot(xs, 3*ys)
ax[19].plot(ys**2, xs)

plt.show()  # finally, render the plot

生成的图表如下:

enter image description here

编辑2

在前面的例子中,代码使用单个索引访问子图非常不方便,特别是当图形具有多行/列子图时。以下提供了一种替代方法。下面的代码使用[row_index][column_index]来访问子图,更适合操作包含多个子图的数组。

import matplotlib.pyplot as plt
import numpy as np

# settings
h, w = 10, 10        # for raster image
nrows, ncols = 5, 4  # array of sub-plots
figsize = [6, 8]     # figure size, inches

# prep (x,y) for extra plotting on selected sub-plots
xs = np.linspace(0, 2*np.pi, 60)  # from 0 to 2pi
ys = np.abs(np.sin(xs))           # absolute of sine

# create figure (fig), and array of axes (ax)
fig, ax = plt.subplots(nrows=nrows, ncols=ncols, figsize=figsize)

# plot simple raster image on each sub-plot
for i, axi in enumerate(ax.flat):
    # i runs from 0 to (nrows*ncols-1)
    # axi is equivalent with ax[rowid][colid]
    img = np.random.randint(10, size=(h,w))
    axi.imshow(img, alpha=0.25)
    # get indices of row/column
    rowid = i // ncols
    colid = i % ncols
    # write row/col indices as axes' title for identification
    axi.set_title("Row:"+str(rowid)+", Col:"+str(colid))

# one can access the axes by ax[row_id][col_id]
# do additional plotting on ax[row_id][col_id] of your choice
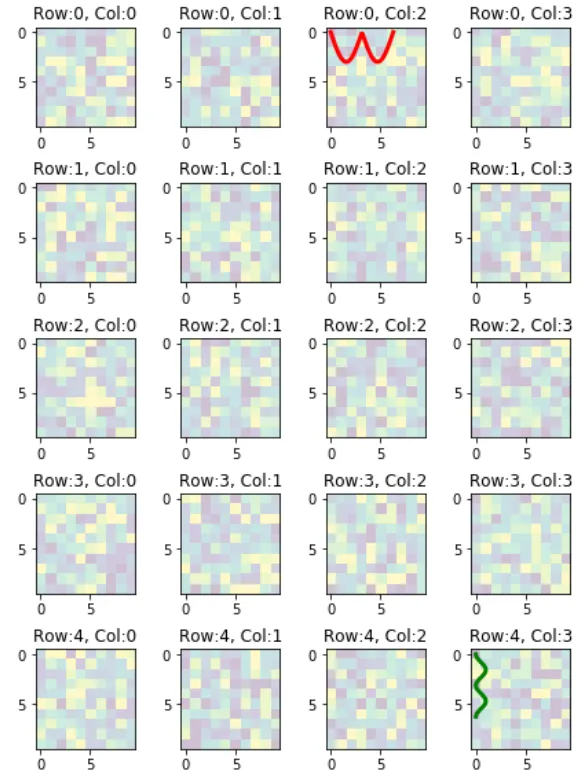
ax[0][2].plot(xs, 3*ys, color='red', linewidth=3)
ax[4][3].plot(ys**2, xs, color='green', linewidth=3)

plt.tight_layout(True)
plt.show()

结果图:

plot3

多子图的刻度和刻度标签

如果所有的子图共享相同的值范围,那么可以隐藏部分子图上的刻度和刻度标签以获得更清晰的图形。可以隐藏所有的刻度和刻度标签,除了左边和底部的外边缘,就像这个图一样。

share_ticklabels

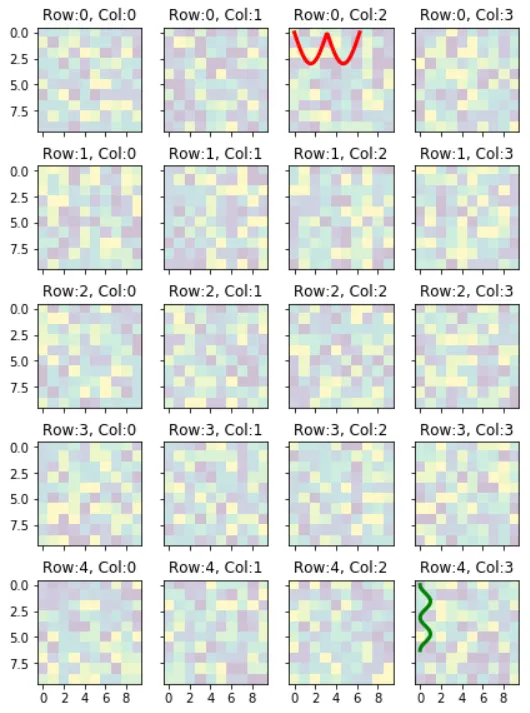
要实现只显示左侧和底部边缘共享的刻度标签的图形,可以执行以下操作:

fig, ax = plt.subplots() 中添加选项 sharex=True, sharey=True

代码变为:

fig,ax=plt.subplots(nrows=nrows,ncols=ncols,figsize=figsize,sharex=True,sharey=True)
为了指定绘制的所需刻度数和标签,请在 for i, axi in enumerate(ax.flat): 的代码块内添加以下代码。
axi.xaxis.set_major_locator(plt.MaxNLocator(5))
axi.yaxis.set_major_locator(plt.MaxNLocator(4))

数字5和4代表要绘制的刻度线/刻度标签的数量。您可能需要其他适合您的图表的值。


3
要想去掉子图周围的数字/标记,可以这样做:ax = fig.add_subplot(rows, columns, i) ax.set_xticks([]) ax.set_yticks([]) - PlsWork
@AnnaVopureta; 其实可以操作所选轴,比如ax[5],然后使用类似于 ax[5].set_xxxx(yyy)这样的语法。这是更一般化的想法。 - swatchai
你如何保存这个图形? - JustGettinStarted
plt.savefig('your_preferred_filename.png') - Soumendra

7
您可以尝试以下方法:
import matplotlib.pyplot as plt
import numpy as np

def plot_figures(figures, nrows = 1, ncols=1):
    """Plot a dictionary of figures.

    Parameters
    ----------
    figures : <title, figure> dictionary
    ncols : number of columns of subplots wanted in the display
    nrows : number of rows of subplots wanted in the figure
    """

    fig, axeslist = plt.subplots(ncols=ncols, nrows=nrows)
    for ind,title in zip(range(len(figures)), figures):
        axeslist.ravel()[ind].imshow(figures[title], cmap=plt.jet())
        axeslist.ravel()[ind].set_title(title)
        axeslist.ravel()[ind].set_axis_off()
    plt.tight_layout() # optional


# generation of a dictionary of (title, images)
number_of_im = 20
w=10
h=10
figures = {'im'+str(i): np.random.randint(10, size=(h,w)) for i in range(number_of_im)}

# plot of the images in a figure, with 5 rows and 4 columns
plot_figures(figures, 5, 4)

plt.show()

然而,这基本上只是从这里复制并粘贴:在单个窗口中显示多个图像,因此应该考虑将此帖子视为重复内容。
我希望这可以帮助您。

网页内容由stack overflow 提供, 点击上面的
可以查看英文原文,
原文链接