你可以根据
subplots 命令(注意末尾的
s ,与 urinieto 指向的
subplot 命令不同)在
matplotlib.pyplot 中定义一个函数。
以下是一个基于你的示例的这样的函数示例,允许在一个图中绘制多个坐标轴。您可以在图布局中定义想要的行数和列数。
def plot_figures(figures, nrows = 1, ncols=1):
"""Plot a dictionary of figures.
Parameters
----------
figures : <title, figure> dictionary
ncols : number of columns of subplots wanted in the display
nrows : number of rows of subplots wanted in the figure
"""
fig, axeslist = plt.subplots(ncols=ncols, nrows=nrows)
for ind,title in enumerate(figures):
axeslist.ravel()[ind].imshow(figures[title], cmap=plt.gray())
axeslist.ravel()[ind].set_title(title)
axeslist.ravel()[ind].set_axis_off()
plt.tight_layout()
这个函数会根据你想要的行数 (nrows) 和列数 (ncols) 在图形中创建多个轴,然后遍历轴列表以绘制你的图像并为每个图像添加标题。
请注意,如果你的字典中只有一张图片,你之前的语法 plot_figures(figures) 将会起作用,因为默认情况下 nrows 和 ncols 均设置为 1。
以下是一个示例:
import matplotlib.pyplot as plt
import numpy as np
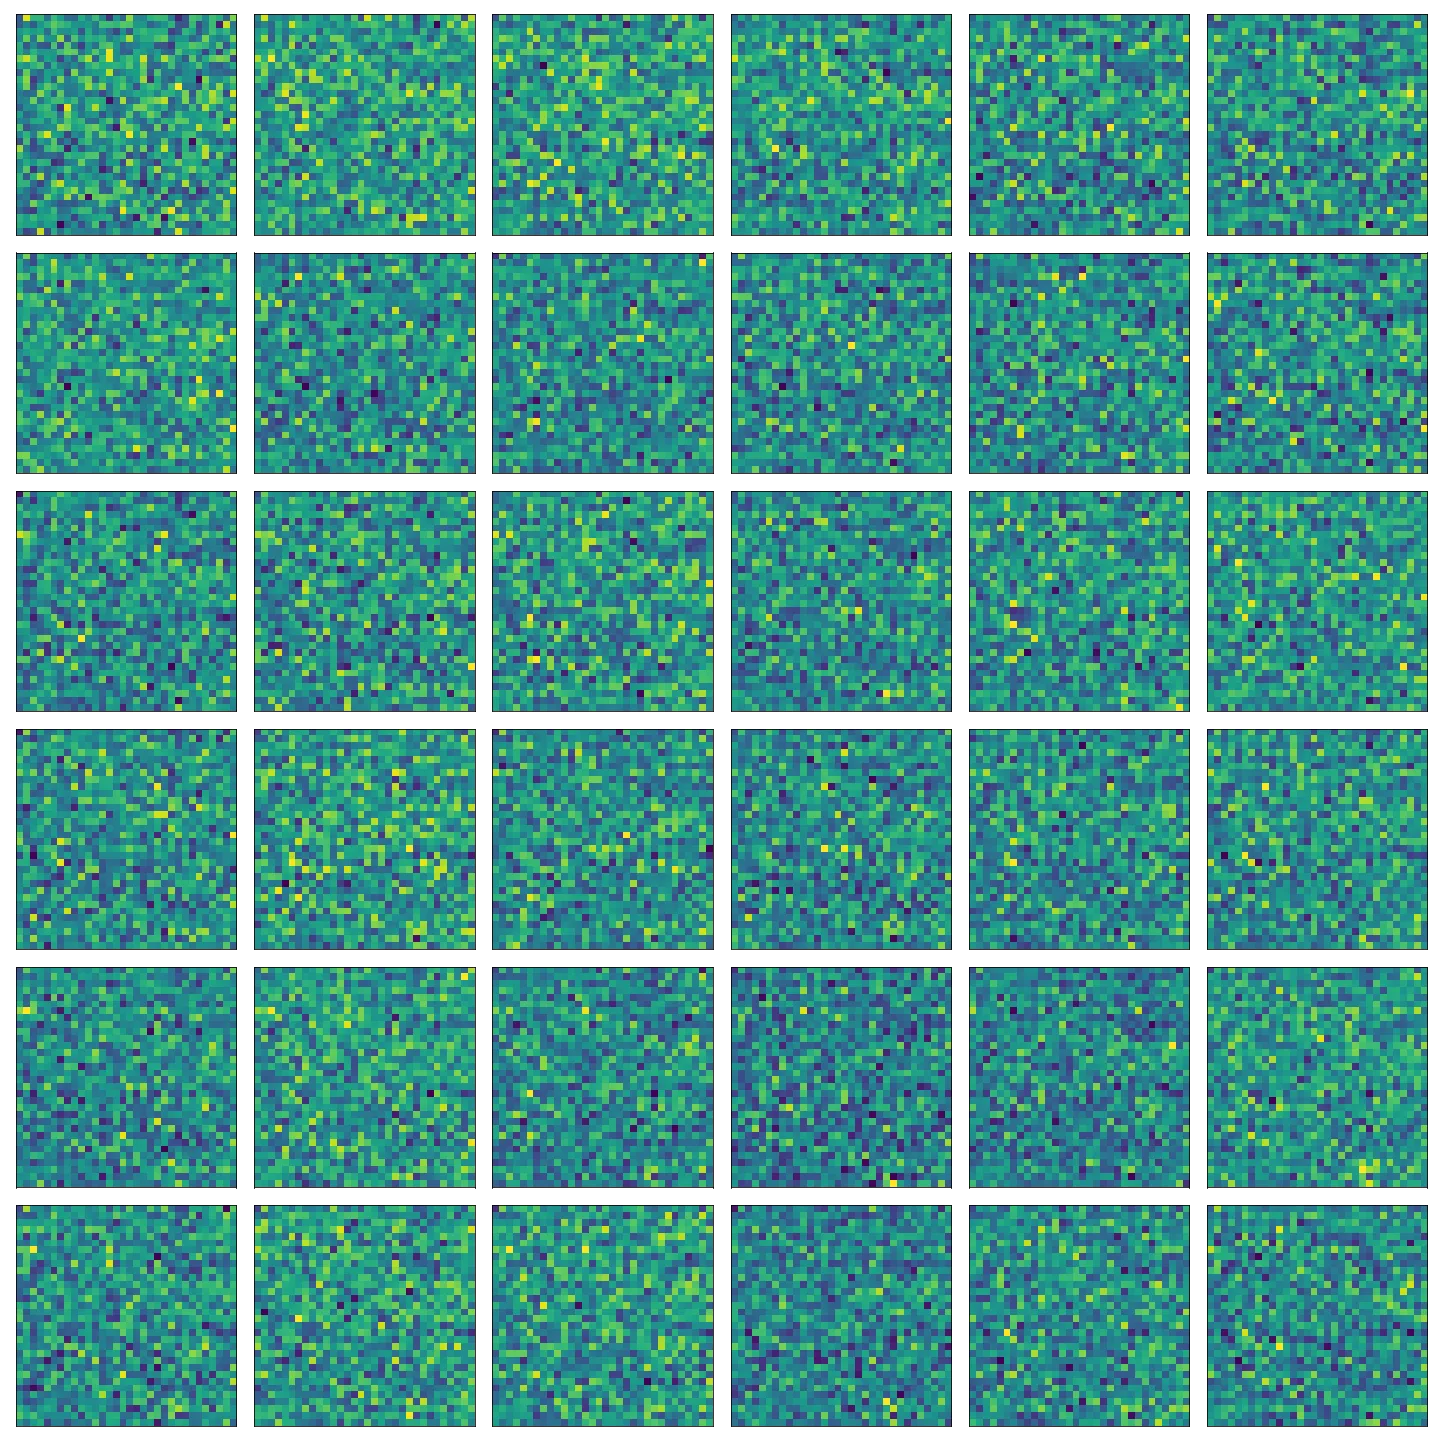
number_of_im = 6
figures = {'im'+str(i): np.random.randn(100, 100) for i in range(number_of_im)}
plot_figures(figures, 2, 3)

(该内容为一段HTML代码,其中包含一个图片标签,图片的来源是"https://i.imgur.com/pxiC8.png",并且在该图片无法显示时会显示“ex”的代替文本)