在matplotlib中,是否可以以十六进制的方式打印X轴上的值?
对于我的绘图,X轴表示内存地址。
在matplotlib中,是否可以以十六进制的方式打印X轴上的值?
对于我的绘图,X轴表示内存地址。
在一台64位机器上使用Python 3.5时,由于类型不匹配而出现错误。
TypeError: %x format: an integer is required, not numpy.float64
我通过使用一个函数格式化程序来绕过它,以便能够将其转换为整数。
import matplotlib.pyplot as plt
import matplotlib.ticker as ticker

def to_hex(x, pos):
    return '%x' % int(x)

fmt = ticker.FuncFormatter(to_hex)

plt.plot([10, 20, 30], [1, 3, 2])
axes = plt.gca()
axes.get_xaxis().set_major_locator(ticker.MultipleLocator(1))
axes.get_xaxis().set_major_formatter(fmt)
plt.show()
import matplotlib.pyplot as plt
import matplotlib.ticker as ticker


plt.plot([10, 20, 30], [1, 3, 2])
axes = plt.gca()
axes.get_xaxis().set_major_locator(ticker.MultipleLocator(1))
axes.get_xaxis().set_major_formatter(ticker.FormatStrFormatter("%x"))
plt.show()
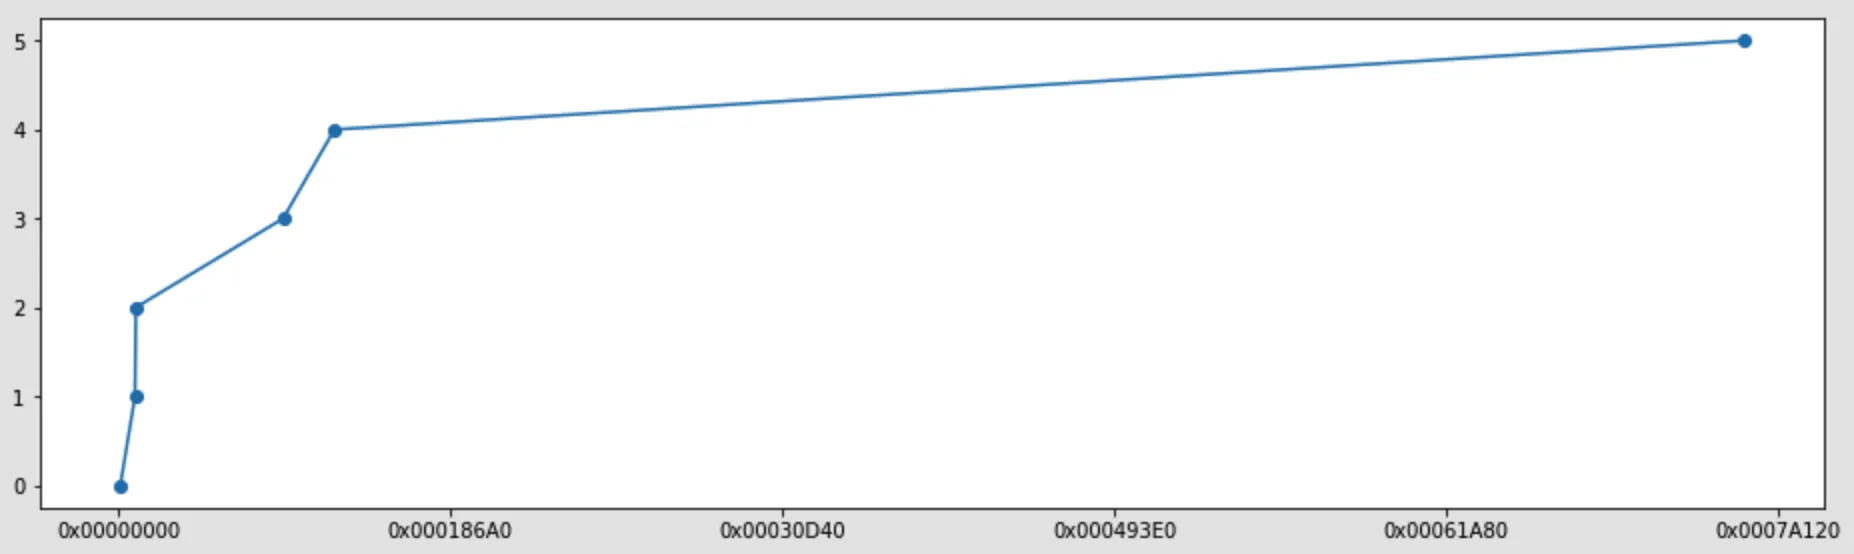
另一种方法是这样的:
import matplotlib.pyplot as plt

# Just some 'random' data
x = sorted([489465, 49498, 5146, 4894, 64984, 465])
y = list(range(len(x)))

fig = plt.figure(figsize=(16, 4.5))
ax = fig.gca()
plt.plot(x, y, marker='o')

# Create labels
xlabels = map(lambda t: '0x%08X' % int(t), ax.get_xticks())
ax.set_xticklabels(xlabels);
结果: