有多种方法可以做到这一点。
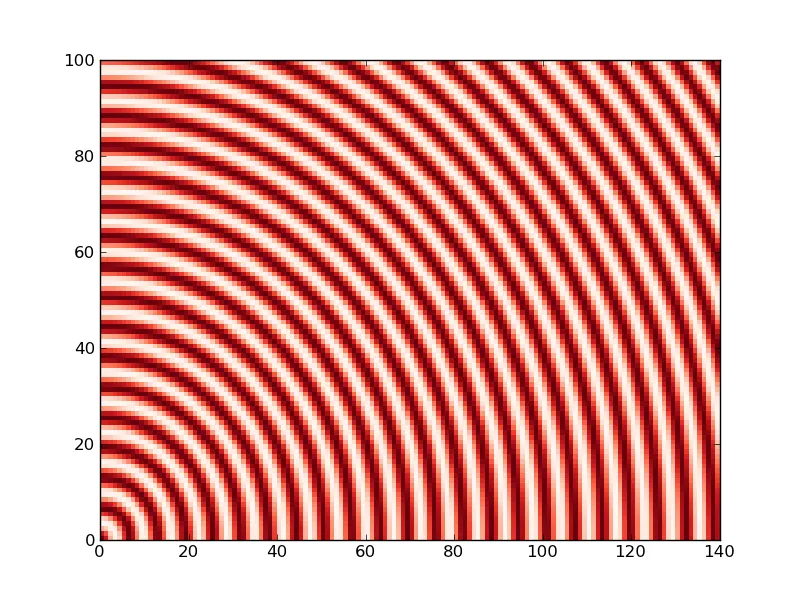
让我们从一个示例情节开始:
import matplotlib.pyplot as plt
import matplotlib as mpl
import numpy as np
x, y = np.mgrid[:141, :101]
z = np.cos(np.hypot(x, y))
plt.pcolormesh(x, y, z, cmap=mpl.cm.Reds)
plt.show()
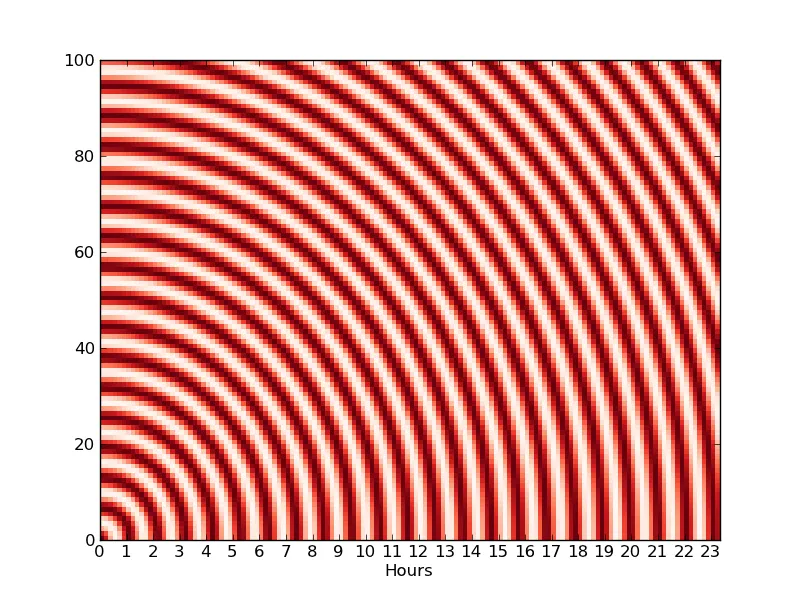
你想要的简单方法可能是像这样的:
import matplotlib.pyplot as plt
import matplotlib as mpl
import numpy as np
x, y = np.mgrid[:141, :101]
z = np.cos(np.hypot(x, y))
plt.pcolormesh(x, y, z, cmap=mpl.cm.Reds)
ticks = np.arange(x.min(), x.max(), 6)
labels = range(ticks.size)
plt.xticks(ticks, labels)
plt.xlabel('Hours')
plt.show()
另一种方法涉及对matplotlib的定位器和刻度进行子类化。
对于您的目的,上面的示例很好。
制作新的定位器和刻度的优点是,轴将自动缩放为您指定的“dx”单位的合理间隔。如果您将其用作较大应用程序的一部分,则可能值得。对于单个绘图而言,这比它值得的麻烦更多。
不过,如果您真的想走这条路,可以像这样做:
import matplotlib.pyplot as plt
import matplotlib as mpl
import numpy as np
def main():
x, y = np.mgrid[:141, :101]
z = np.cos(np.hypot(x, y))
fig, ax = plt.subplots()
ax.pcolormesh(x, y, z, cmap=mpl.cm.Reds)
ax.set_xlabel('Hours')
ax.xaxis.set_major_locator(ScaledLocator(dx=6))
ax.xaxis.set_major_formatter(ScaledFormatter(dx=6))
plt.show()
class ScaledLocator(mpl.ticker.MaxNLocator):
"""
Locates regular intervals along an axis scaled by *dx* and shifted by
*x0*. For example, this would locate minutes on an axis plotted in seconds
if dx=60. This differs from MultipleLocator in that an approriate interval
of dx units will be chosen similar to the default MaxNLocator.
"""
def __init__(self, dx=1.0, x0=0.0):
self.dx = dx
self.x0 = x0
mpl.ticker.MaxNLocator.__init__(self, nbins=9, steps=[1, 2, 5, 10])
def rescale(self, x):
return x / self.dx + self.x0
def inv_rescale(self, x):
return (x - self.x0) * self.dx
def __call__(self):
vmin, vmax = self.axis.get_view_interval()
vmin, vmax = self.rescale(vmin), self.rescale(vmax)
vmin, vmax = mpl.transforms.nonsingular(vmin, vmax, expander = 0.05)
locs = self.bin_boundaries(vmin, vmax)
locs = self.inv_rescale(locs)
prune = self._prune
if prune=='lower':
locs = locs[1:]
elif prune=='upper':
locs = locs[:-1]
elif prune=='both':
locs = locs[1:-1]
return self.raise_if_exceeds(locs)
class ScaledFormatter(mpl.ticker.OldScalarFormatter):
"""Formats tick labels scaled by *dx* and shifted by *x0*."""
def __init__(self, dx=1.0, x0=0.0, **kwargs):
self.dx, self.x0 = dx, x0
def rescale(self, x):
return x / self.dx + self.x0
def __call__(self, x, pos=None):
xmin, xmax = self.axis.get_view_interval()
xmin, xmax = self.rescale(xmin), self.rescale(xmax)
d = abs(xmax - xmin)
x = self.rescale(x)
s = self.pprint_val(x, d)
return s
if __name__ == '__main__':
main()
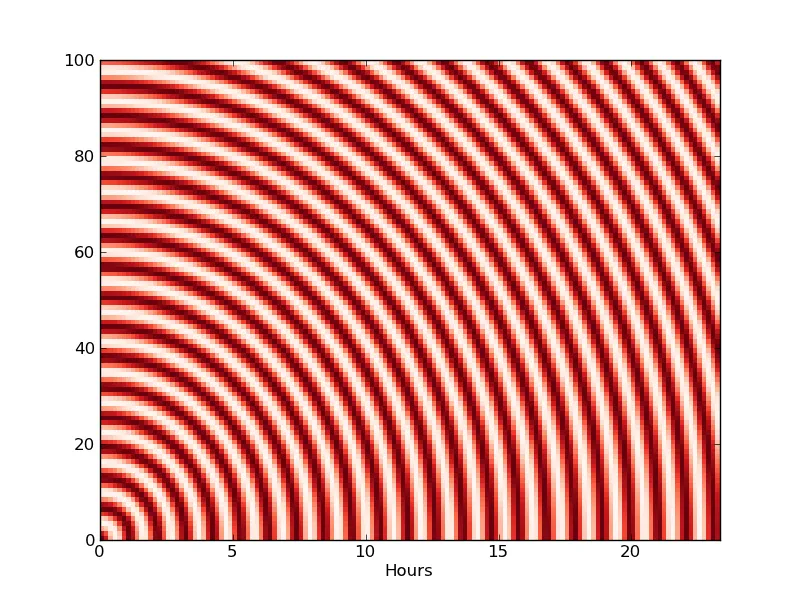
 上面是上图的代码。