我需要在地理图上绘制一些数据。具体而言,我想突出显示数据来自哪些国家和州。 我的数据集是:
    Year    Country State/City
0   2009    BGR     Sofia
1   2018    BHS     New Providence
2   2002    BLZ     NaN
3   2000    CAN     California
4   2002    CAN     Ontario
... ... ... ...
250 2001    USA     Ohio
251 1998    USA     New York
252 1995    USA     Virginia
253 2011    USA     NaN
254 2019    USA     New York
为了创建地理图,我一直使用以下方式的 geopandas:
import geopandas as gpd

shapefile = 'path/ne_110m_admin_0_countries/ne_110m_admin_0_countries.shp'
gdf = gpd.read_file(shapefile)[['ADMIN', 'ADM0_A3', 'geometry']]
gdf.columns = ['country', 'country_code', 'geometry']
然后我合并了这两个数据集:
merged = gdf.merge(df, left_on = 'country_code', right_on = 'Country')
并将数据转换为 JSON 格式:
import json

merged_json = json.loads(merged.to_json())
#Convert to String like object.
json_data = json.dumps(merged_json)
最后,我尝试按照以下方式创建图表:
from bokeh.io import output_notebook, show, output_file
from bokeh.plotting import figure
from bokeh.models import GeoJSONDataSource, LinearColorMapper, ColorBar
from bokeh.palettes import brewer

geosource = GeoJSONDataSource(geojson = json_data)

#Define a sequential multi-hue color palette.
palette = brewer['YlGnBu'][8]
palette = palette[::-1]
color_mapper = LinearColorMapper(palette = palette, low = 0, high = 40)

tick_labels = {'0': '0%', '5': '5%', '10':'10%', '15':'15%', '20':'20%', '25':'25%', '30':'30%','35':'35%', '40': '>40%'}

color_bar = ColorBar(color_mapper=color_mapper, label_standoff=8,width = 500, height = 20,
border_line_color=None,location = (0,0), orientation = 'horizontal', major_label_overrides = tick_labels)

p = figure(title = 'Creation year across countries', plot_height = 600 , plot_width = 950, toolbar_location = None)
p.xgrid.grid_line_color = None
p.ygrid.grid_line_color = None

p.patches('xs','ys', source = geosource,fill_color = {'field' :'per_cent_year', 'transform' : color_mapper},
          line_color = 'black', line_width = 0.25, fill_alpha = 1)

p.add_layout(color_bar, 'below')

output_notebook()

#Display figure.
show(p)
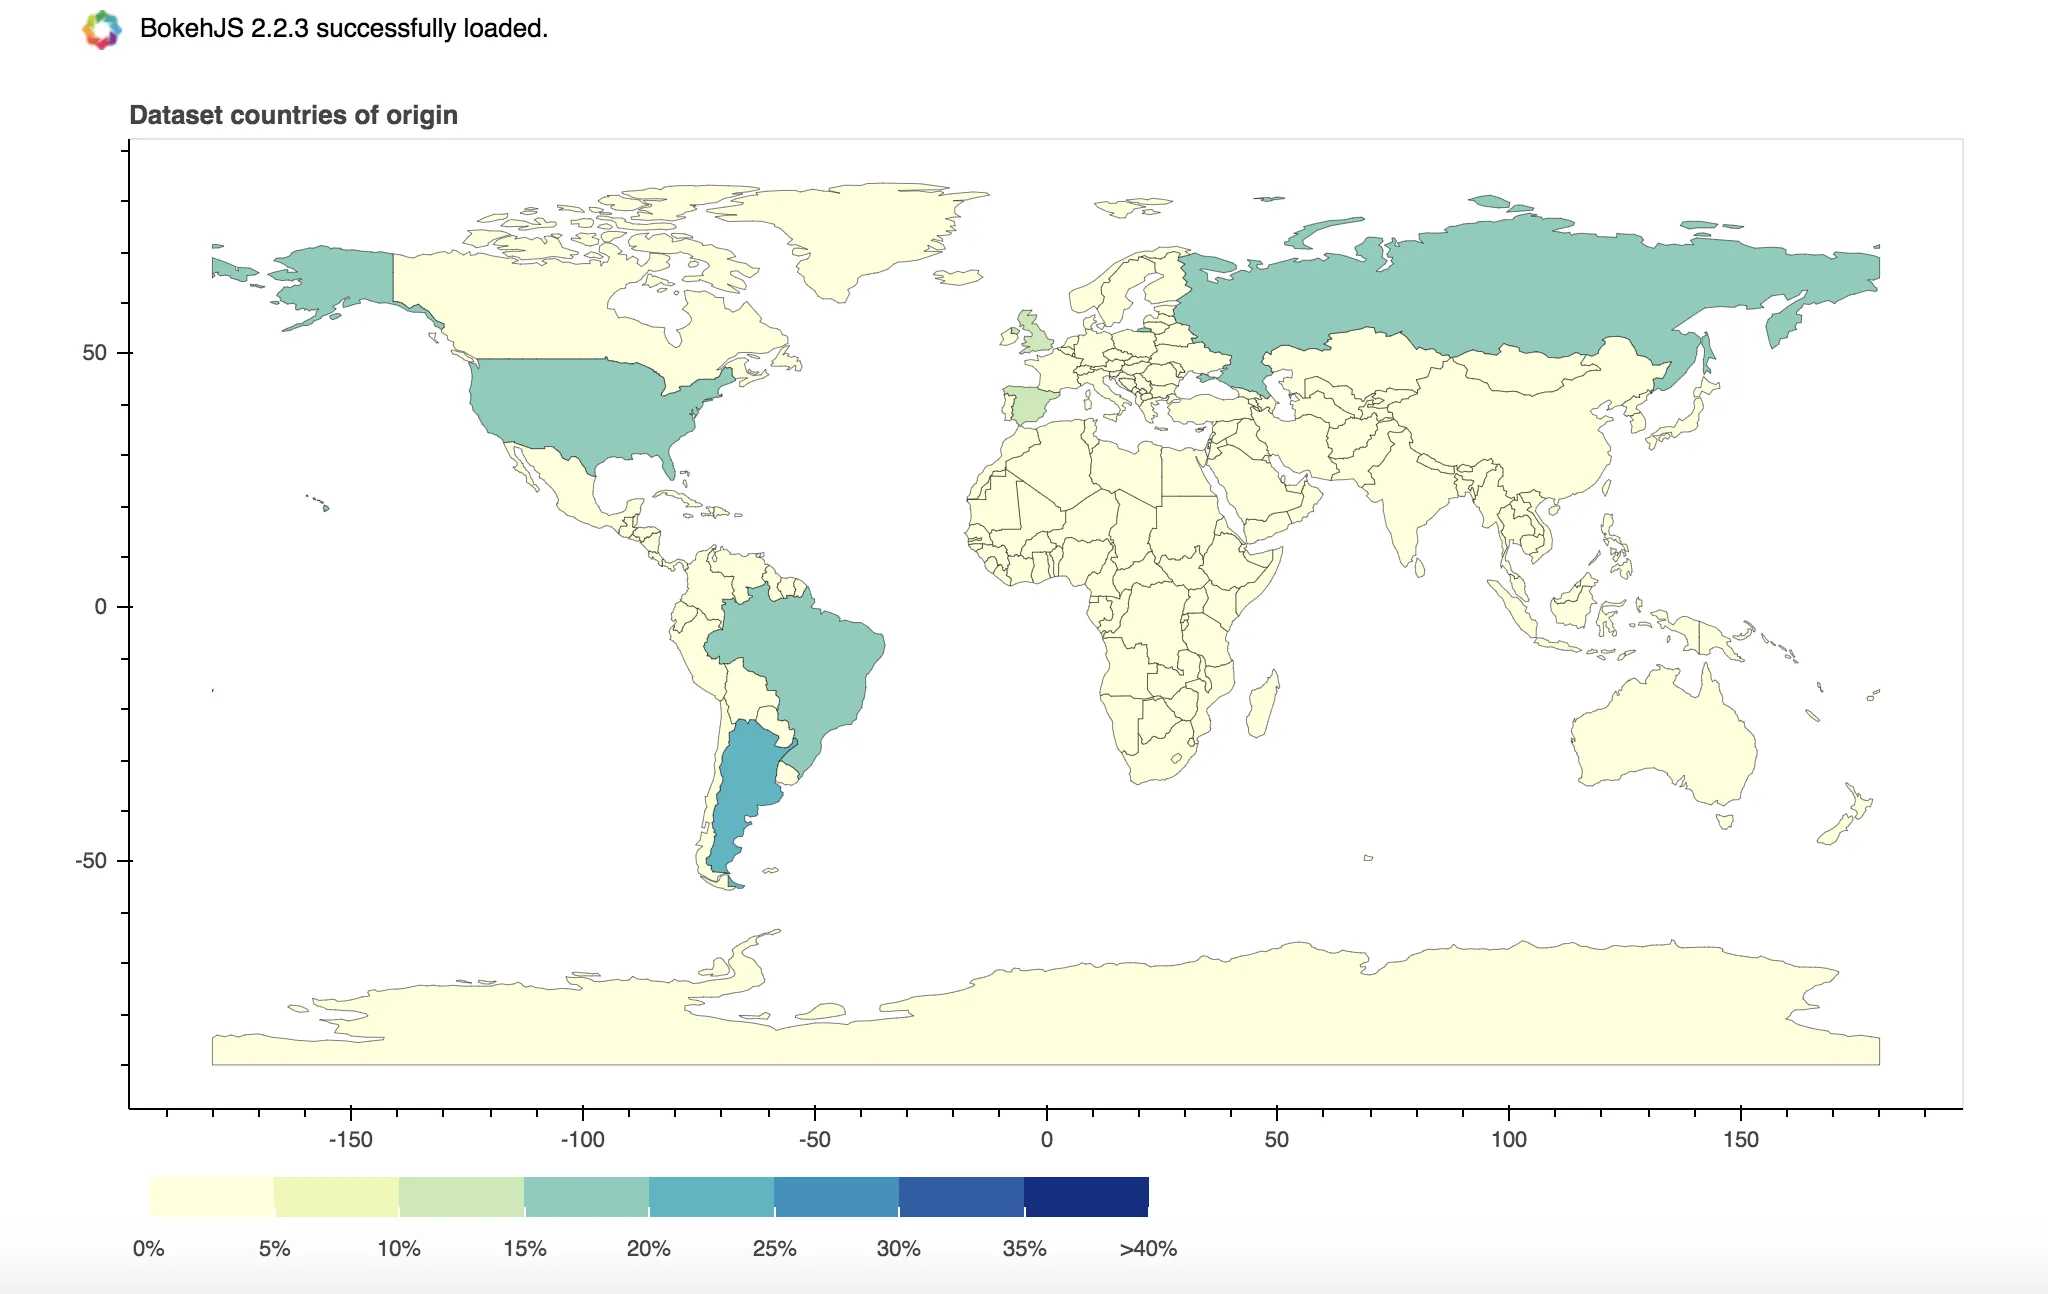
当我运行它时,它会显示
BokehJS 1.0.2 successfully loaded,但它不显示任何内容。
我的期望结果是显示一张地图,颜色基于每个国家出现的次数(例如USA=5将更加深色),另一张地图则基于州/城市(纽约将更加深色)。上述代码有什么问题吗?
(如果需要,可以分享更多数据/信息)