地理数据处理库Geopandas的子图绘制

6

假设我有一个包含3个多边形对象的geodataframe。

import geopandas as gpd
from shapely.geometry import Polygon

p1=Polygon([(0,0),(0,1),(1,1),(1,0)])
p2=Polygon([(3,3),(3,6),(6,6),(6,3)])
p3=Polygon([(3,.5),(4,2),(5,.5)])

gdf=gpd.GeoDataFrame(geometry=[p1,p2,p3])
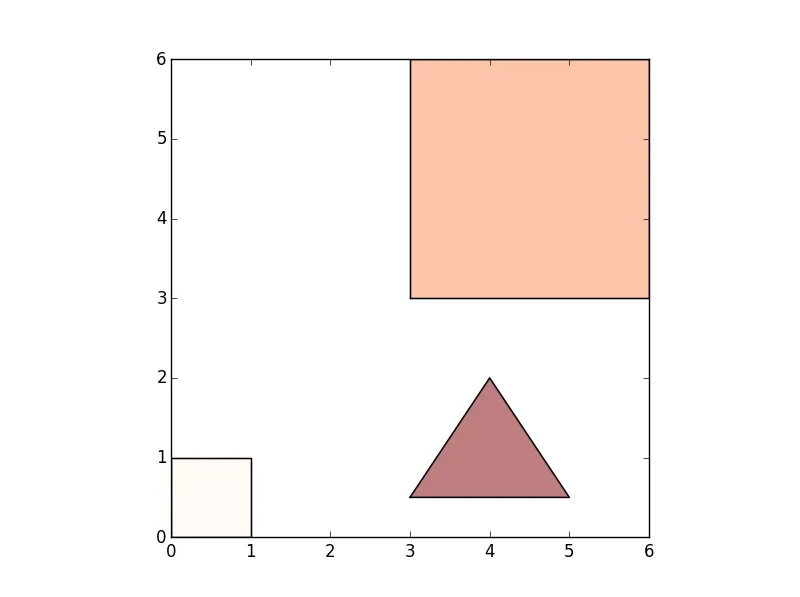
gdf['Value1']=[1,10,20]
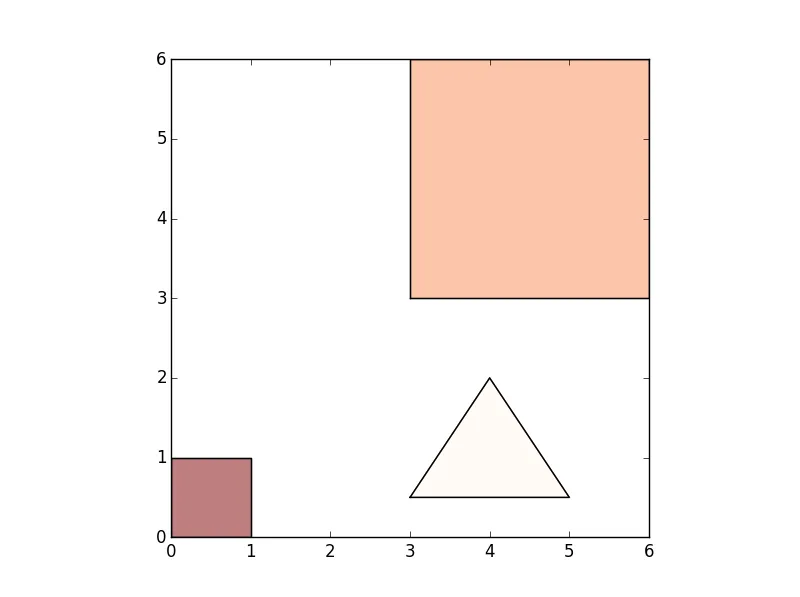
gdf['Value2']=[300,200,100]

gdf 内容:

>>> gdf
                               geometry  Value1  Value2
0   POLYGON ((0 0, 0 1, 1 1, 1 0, 0 0))       1     300
1   POLYGON ((3 3, 3 6, 6 6, 6 3, 3 3))      10     200
2  POLYGON ((3 0.5, 4 2, 5 0.5, 3 0.5))      20     100
>>> 

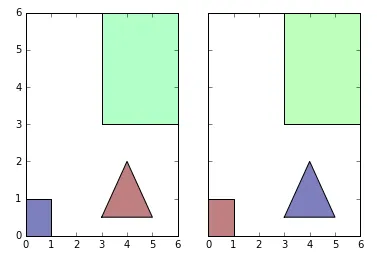
如果我调用geopandas.plot()两次,我可以为每个图形制作一个单独的图。然而,有没有一种方式可以在同一个图中作为子图并排绘制这两张地图?

enter image description here

enter image description here


2
请在这个问题中加入你用于生成图形的绘图命令,这将大大改善它。 - Paul H
2个回答

13

永远 一定 始终 提前创建你的matplotlib对象,并将它们传递给绘图方法(或直接使用它们)。这样做,你的代码变成:

from matplotlib import pyplot
import geopandas
from shapely import geometry

p1 = geometry.Polygon([(0,0),(0,1),(1,1),(1,0)])
p2 = geometry.Polygon([(3,3),(3,6),(6,6),(6,3)])
p3 = geometry.Polygon([(3,.5),(4,2),(5,.5)])

gdf = geopandas.GeoDataFrame(dict(
        geometry=[p1, p2, p3],
        Value1=[1, 10, 20],
        Value2=[300, 200, 100],
))

fig, (ax1, ax2) = pyplot.subplots(ncols=2, sharex=True, sharey=True)
gdf.plot(ax=ax1, column='Value1')
gdf.plot(ax=ax2, column='Value2')

这给了我:

输入图像描述


嗯,实际上当我运行你的代码时,我得到了以下错误信息:“plot_multipolygon()对关键字参数'ax'有多个值”。也许我们正在使用不同版本的geopandas? - AJG519
1
我正在使用 geopandas 版本 0.2.0。 - Paul H

0
// for plotting multiple GeoDataframe 
import geopandas as gpd

gdf = gpd.read_file(geojson) 
fig, axes = plt.subplots(1,4, figsize=(40,10))
axes[0].set_title('Some Title')
gdf.plot(ax=axes[0], column='Some column for coloring', cmap='coloring option')

axes[0].set_title('Some Title')
gdf.plot(ax=axes[0], column='Some column for coloring', cmap='coloring option')

网页内容由stack overflow 提供, 点击上面的
可以查看英文原文,
原文链接