我正在考虑一个包含3行4列的图形,其中:
有3个依赖变量要绘制: Y1、Y2 和 Y3,与一个共同的独立变量 X 相关,共有 4 种研究情况:
在这种情况下:
1) 当从 case i 到 case i+1 时,y 轴是共享的。
2) 在一个 case i 中,x 轴是共享的。
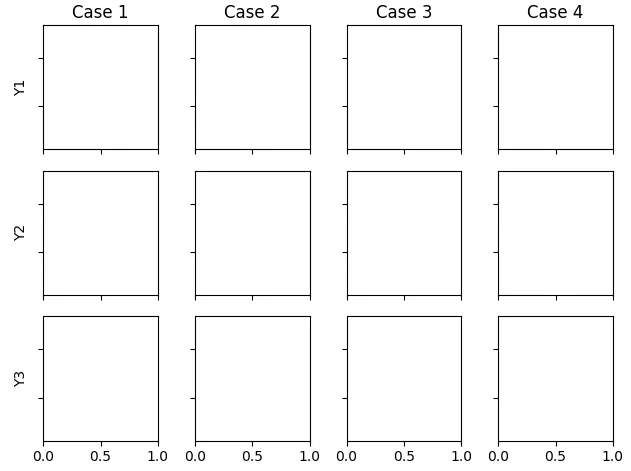
因此,原则上,人们会认为以下代码将生成所需的绘图 (结果显示在上图中):
fig, axes = plt.subplots(ncols=4, nrows=3,\
                         sharex=True, sharey=True,\
                         subplot_kw=dict(adjustable='box-forced'))
其中adjustable='box-forced'只是为了确保子图成为正方形,详细解释请查阅这里。
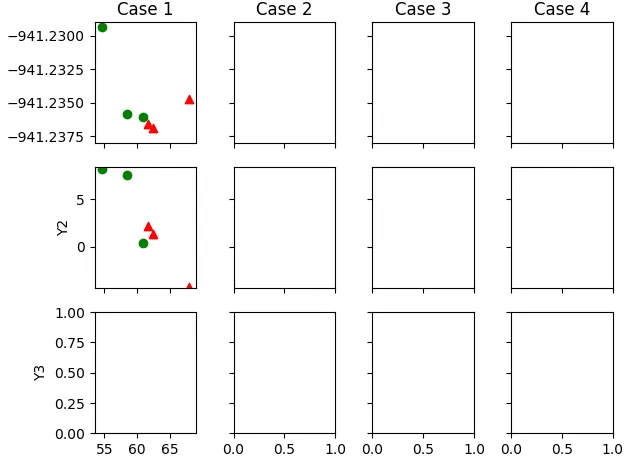
当我尝试绘制第1种情况下Y1与X的图时:
import numpy as np
import matplotlib.pyplot as plt
import sys

fig, axes = plt.subplots(ncols=4, nrows=3,\
                         sharex=True, sharey=True,\
                         subplot_kw=dict(adjustable='box-forced'))

pad = 5
axes[0][0].annotate('Case 1', xy=(0.5, 1), xytext=(0, pad),
                xycoords='axes fraction', textcoords='offset points',
                 size='large', ha='center', va='baseline')

axes[0][1].annotate('Case 2', xy=(0.5, 1), xytext=(0, pad),
                xycoords='axes fraction', textcoords='offset points',
                 size='large', ha='center', va='baseline')

axes[0][2].annotate('Case 3', xy=(0.5, 1), xytext=(0, pad),
               xycoords='axes fraction', textcoords='offset points',
                size='large', ha='center', va='baseline')

axes[0][3].annotate('Case 4', xy=(0.5, 1), xytext=(0, pad),
                xycoords='axes fraction', textcoords='offset points',
                 size='large', ha='center', va='baseline')

#
axes[0][0].set_ylabel('Y1', fontsize=10)
axes[1][0].set_ylabel('Y2', fontsize=10)
axes[2][0].set_ylabel('Y3', fontsize=10)

E_C_I =  np.array([-941.23658347, -941.23685494, -941.23467666])
V_C_I =  np.array([ 61.66341, 62.342903,  67.9311515])
E_14 =  np.array([-941.22938469, -941.23583586, -941.23605613])
V_14 =  np.array([ 54.65693125,  58.47115725, 60.8626545 ])
P_C_I =  np.array([ 2.20068119,  1.33328211,  -4.28370285])
P_14 =  np.array([ 8.16605135,  7.54737315, 0.3909309 ])


axes[0][0].scatter(V_C_I, E_C_I, marker='^', color='red', label='Calcite I')#, s=100)
axes[0][0].scatter(V_14, E_14, marker='o', color='green', label='Calcite I')#, s=100)

axes[0][0].set_ylim(bottom=-941.238, top=-941.229)

plt.tight_layout()
axes[0][0].ticklabel_format(useOffset=False)
plt.show()
sys.exit()
一切看起来都很好:
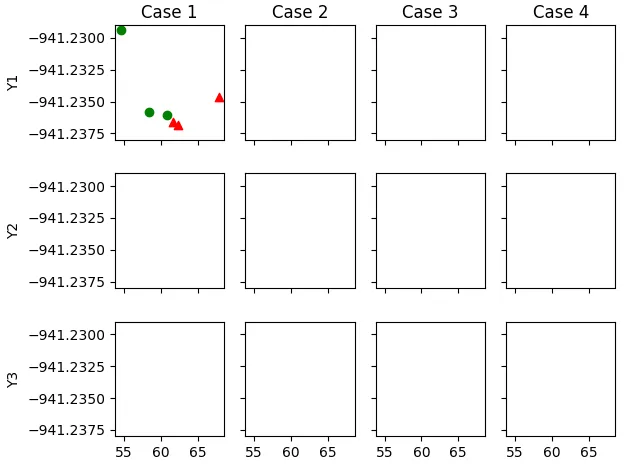
我已经强制将绘图设置为 axes[0][0].set_ylim(bottom=-941.238, top=-941.229)
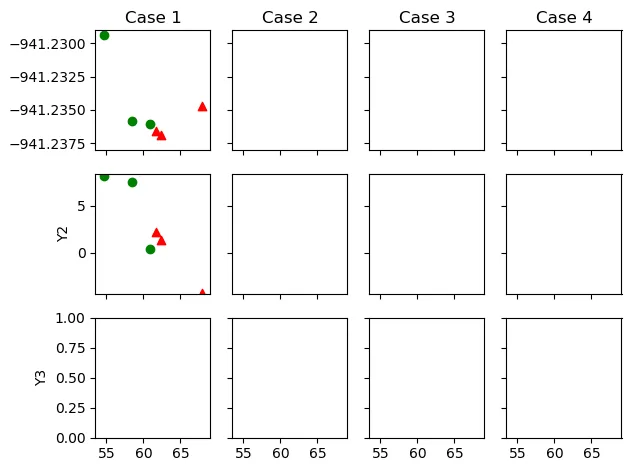
当我尝试绘制Case 1的X与Y2时,以下代码应该可以工作:我基本上做了与之前相同的事情,但添加了axes[1][0]的绘图指令:
import numpy as np
import matplotlib.pyplot as plt
import sys

fig, axes = plt.subplots(ncols=4, nrows=3,\
                         sharex=True, sharey=True,\
                         subplot_kw=dict(adjustable='box-forced'))

pad = 5
axes[0][0].annotate('Case 1', xy=(0.5, 1), xytext=(0, pad),
                xycoords='axes fraction', textcoords='offset points',
                 size='large', ha='center', va='baseline')

axes[0][1].annotate('Case 2', xy=(0.5, 1), xytext=(0, pad),
                xycoords='axes fraction', textcoords='offset points',
                 size='large', ha='center', va='baseline')

axes[0][2].annotate('Case 3', xy=(0.5, 1), xytext=(0, pad),
               xycoords='axes fraction', textcoords='offset points',
                size='large', ha='center', va='baseline')

axes[0][3].annotate('Case 4', xy=(0.5, 1), xytext=(0, pad),
                xycoords='axes fraction', textcoords='offset points',
                 size='large', ha='center', va='baseline')

#
axes[0][0].set_ylabel('Y1', fontsize=10)
axes[1][0].set_ylabel('Y2', fontsize=10)
axes[2][0].set_ylabel('Y3', fontsize=10)

E_C_I =  np.array([-941.23658347, -941.23685494, -941.23467666])
V_C_I =  np.array([ 61.66341, 62.342903,  67.9311515])
E_14 =  np.array([-941.22938469, -941.23583586, -941.23605613])
V_14 =  np.array([ 54.65693125,  58.47115725, 60.8626545 ])
P_C_I =  np.array([ 2.20068119,  1.33328211,  -4.28370285])
P_14 =  np.array([ 8.16605135,  7.54737315, 0.3909309 ])


axes[0][0].scatter(V_C_I, E_C_I, marker='^', color='red', label='Calcite I')#, s=100)
axes[0][0].scatter(V_14, E_14, marker='o', color='green', label='Calcite I')#, s=100)

axes[0][0].set_ylim(bottom=-941.238, top=-941.229)

axes[1][0].scatter(V_C_I, P_C_I, marker='^', color='red', label='Calcite I')#, s=100)
axes[1][0].scatter(V_14, P_14, marker='o', color='green', label='Calcite I')#, s=100)

axes[1][0].set_ylim(bottom=-4.4, top=8.4)

plt.tight_layout()
axes[0][0].ticklabel_format(useOffset=False)
plt.show()
sys.exit()
结果是
axes[0][0]绘图的比例尺已经改变,因此没有显示任何数据:
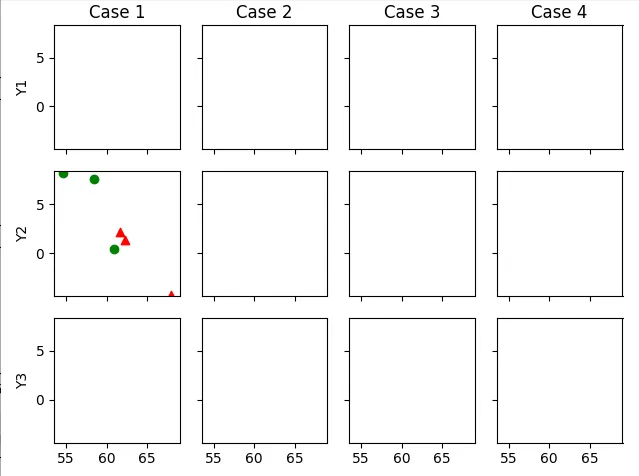
我已经强制让axes[0][0]和axes[0][1]都显示确实存在数据的区域:
axes[0][0].set_ylim(bottom=-941.238, top=-941.229)
axes[1][0].set_ylim(bottom=-4.4, top=8.4)
然而,在
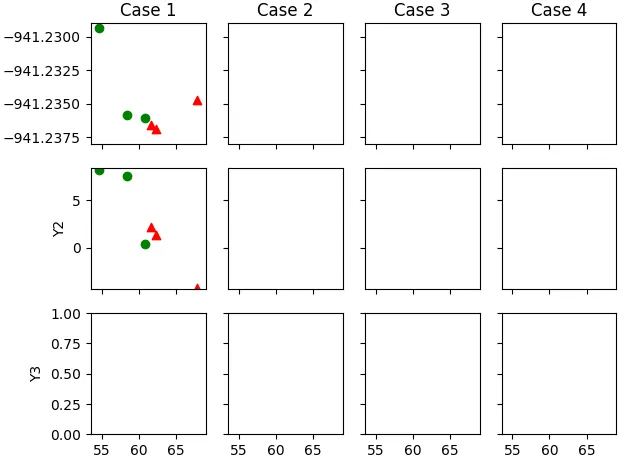
axes[0][0]图中没有显示任何数据。为什么会发生这种情况?更新:在@DavidG的出色回答中,已经澄清了sharey='row'和sharey=True之间的区别。然而,我已经测试了sharex='col'和sharex=True之间的区别,并且我注意到:fig, axes = plt.subplots(ncols=4, nrows=3,\
sharex=True, sharey='row',\
subplot_kw=dict(adjustable='box-forced'))
通过以下方式生成:
然而,
fig, axes = plt.subplots(ncols=4, nrows=3,\
                         sharex='col', sharey='row',\
                         subplot_kw=dict(adjustable='box-forced'))
这种情况在列之间留下了一些空间,并且打破了子图的adjustable='box-forced'声明,以使其成为正方形:
我想知道为什么会发生这种情况?
sharey='row'和sharey=True之间的区别。然而,我注意到sharex=True和sharex='col'之间的差异会产生一种不同的结果(请参见更新的帖子)。 - DavidC.