如何在Matplotlib中取消两个轴的`sharex`或`sharey`?

8
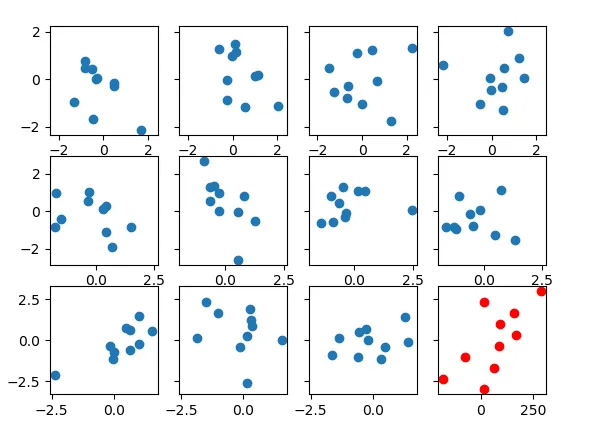
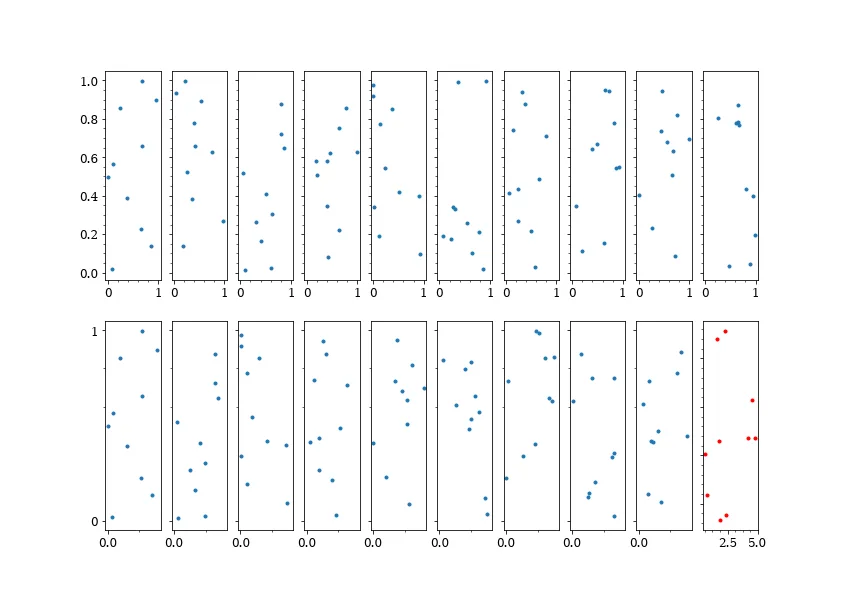
我有一系列的子图,希望它们除了两个子图(每行一个)以外,其余的都共享 x 和 y 轴。
我知道可以先单独创建所有子图,然后添加sharex/sharey功能
但是,考虑到我必须为大多数子图这样做,这需要很多代码。
更有效的方法是创建所有具有所需sharex/sharey属性的子图,例如:
import matplotlib.pyplot as plt

fix, axs = plt.subplots(2, 10, sharex='row', sharey='row', squeeze=False)

然后取消设置 sharex / sharey 功能,这理论上可以工作如下:

axs[0, 9].sharex = False
axs[1, 9].sharey = False

上述方法不起作用,但是否有任何方法可以获得此功能?
3个回答

8

正如@zan在他的答案中指出的,您可以使用ax.get_shared_x_axes()获取一个包含所有链接轴的Grouper对象,然后从该Grouper中.remove任何轴。 问题是(正如@WMiller所指出的),所有轴的刻度线仍然相同。

因此,需要执行以下操作:

  1. 从Grouper中删除轴
  2. 使用相应的新定位器和格式设置器设置新的刻度线

完整示例:

import matplotlib
import matplotlib.pyplot as plt
import numpy as np

fig, axes = plt.subplots(3, 4, sharex='row', sharey='row', squeeze=False)

data = np.random.rand(20, 2, 10)

for ax in axes.flatten()[:-1]:
    ax.plot(*np.random.randn(2,10), marker="o", ls="")


# Now remove axes[1,5] from the grouper for xaxis
axes[2,3].get_shared_x_axes().remove(axes[2,3])

# Create and assign new ticker
xticker = matplotlib.axis.Ticker()
axes[2,3].xaxis.major = xticker

# The new ticker needs new locator and formatters
xloc = matplotlib.ticker.AutoLocator()
xfmt = matplotlib.ticker.ScalarFormatter()

axes[2,3].xaxis.set_major_locator(xloc)
axes[2,3].xaxis.set_major_formatter(xfmt)

# Now plot to the "ungrouped" axes
axes[2,3].plot(np.random.randn(10)*100+100, np.linspace(-3,3,10), 
                marker="o", ls="", color="red")

plt.show()

在此输入图片描述

请注意,上述内容仅更改了x轴的刻度线,也仅更改了主要的刻度线。如果需要,您还需要对y轴和次要刻度线进行相同的更改。


4
您可以使用ax.get_shared_x_axes()来获取包含所有链接轴的Grouper对象。然后使用group.remove(ax)从该组中删除指定的轴。您还可以使用group.join(ax1, ax2)添加新的共享。
import matplotlib.pyplot as plt
import numpy as np

fig, ax = plt.subplots(2, 10, sharex='row', sharey='row', squeeze=False)

data = np.random.rand(20, 2, 10)
for row in [0,1]:
    for col in range(10):
        n = col*(row+1)
        ax[row, col].plot(data[n,0], data[n,1], '.')

a19 = ax[1,9]

shax = a19.get_shared_x_axes()
shay = a19.get_shared_y_axes()
shax.remove(a19)
shay.remove(a19)

a19.clear()
d19 = data[-1] * 5
a19.plot(d19[0], d19[1], 'r.')

plt.show()

这还需要一些微调来设置刻度,但右下角的图现在有了自己的限制。 未共享坐标轴

自 Matplotlib 3.6 起,此功能已被弃用 https://matplotlib.org/stable/api/prev_api_changes/api_changes_3.6.0.html#groupers-from-get-shared-x-axes-get-shared-y-axes-will-be-immutable - LudvigH

2
您可以使用ax.get_shared_x_axes()或属性ax._shared_y_axes来访问共享轴组。然后,您可以使用xaxis.set_tick_params(which='both', labelleft=True)setp(ax, get_xticklabels(), visible=True)重置标签的可见性,但这两种方法都存在同样的固有问题:刻度格式化程序仍然在轴之间共享。据我所知,没有办法解决这个问题。下面是一个示例以说明:最初的回答。
import matplotlib.pyplot as plt
import numpy as np

np.random.seed(1)
fig, axs = plt.subplots(2, 2, sharex='row', sharey='row', squeeze=False)
axs[0][0]._shared_x_axes.remove(axs[0][0])
axs[0][0]._shared_y_axes.remove(axs[0][0])

for ii in range(2):
    for jj in range(2):
        axs[ii][jj].plot(np.random.randn(100), np.linspace(0,ii+jj+1, 100))

axs[0][1].yaxis.set_tick_params(which='both', labelleft=True)
axs[0][1].set_yticks(np.linspace(0,2,7))
plt.show()

Unsetting shared axis


谢谢您指出这一点。我想现在,即使看起来有点不太干净,我仍然会使用选择加入的方法。 - norok2

网页内容由stack overflow 提供, 点击上面的
可以查看英文原文,
原文链接