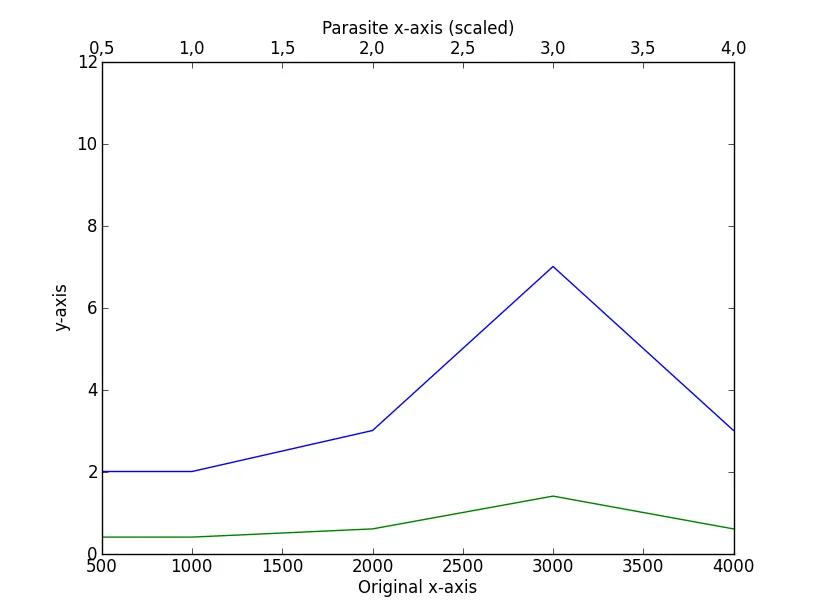
我试图创建一个带有链接的x轴图,使得顶部和底部的刻度/标签都是单位(Joules和kJoules)的测量结果。我看到了一些使用sharex等的示例,但我的需求如下:
- 如何建立链接轴,在第二个轴上生成从第一个轴获取的刻度/标签
- 当更改一个轴的限制时,另一个轴应自动更新
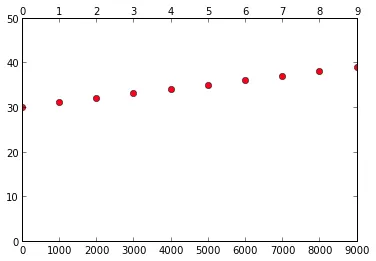
x1 = np.arange(0,10000,1000)
x2 = x1/1000.
y = np.random.randint(0,10,10)

fig, ax = plt.subplots()
ax.plot(x1, y, 'ro')

ax2 = ax.twiny()
ax2.plot(x2,y,visible=False)
plt.show()
这会生成以下结果:
但当我尝试在它们中的任何一个上设置x轴限制时,事情就会出问题。例如,执行ax2.set_xlim(2,5)仅更改顶部轴。
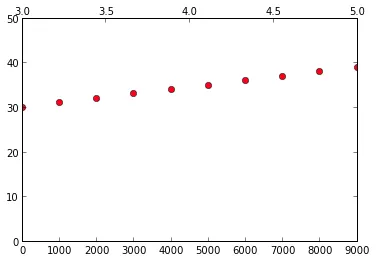
由于我已经知道x1和x2是相关的,所以应该如何设置绘图,以便当我更改一个时,另一个自动处理。
感谢您的帮助。
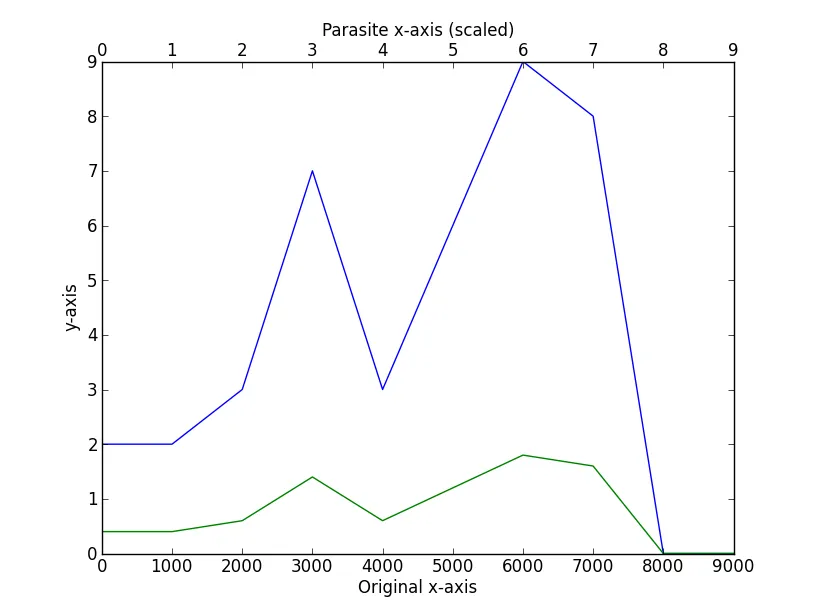 如果您更改
如果您更改