如何生成随机颜色并传递给绘图函数作为一个简单的例子?
我正在循环内调用scatter函数,并希望每个图使用不同的颜色。
for X,Y in data:
   scatter(X, Y, c=??)
c: 一种颜色。c可以是单个颜色格式字符串,或长度为N的颜色规范序列,或一系列需要使用通过kwargs指定的cmap和norm映射到颜色的N个数字序列(见下文)。请注意,c不应该是单个数值RGB或RGBA序列,因为它与要进行颜色映射的值数组无法区分。但c可以是二维数组,其中行是RGB或RGBA。
如何生成随机颜色并传递给绘图函数作为一个简单的例子?
我正在循环内调用scatter函数,并希望每个图使用不同的颜色。
for X,Y in data:
scatter(X, Y, c=??)
c: 一种颜色。c可以是单个颜色格式字符串,或长度为N的颜色规范序列,或一系列需要使用通过kwargs指定的cmap和norm映射到颜色的N个数字序列(见下文)。请注意,c不应该是单个数值RGB或RGBA序列,因为它与要进行颜色映射的值数组无法区分。但c可以是二维数组,其中行是RGB或RGBA。
 以下是执行此操作的函数:
import matplotlib.pyplot as plt

def get_cmap(n, name='hsv'):
    '''Returns a function that maps each index in 0, 1, ..., n-1 to a distinct
    RGB color; the keyword argument name must be a standard mpl colormap name.'''
    return plt.cm.get_cmap(name, n)
在你问题中的伪代码片段中使用:
cmap = get_cmap(len(data))
for i, (X, Y) in enumerate(data):
   scatter(X, Y, c=cmap(i))
import matplotlib.pyplot as plt

def get_cmap(n, name='hsv'):
    '''Returns a function that maps each index in 0, 1, ..., n-1 to a distinct
    RGB color; the keyword argument name must be a standard mpl colormap name.'''
    return plt.cm.get_cmap(name, n)

def main():
    N = 30
    fig=plt.figure()
    ax=fig.add_subplot(111)
    plt.axis('scaled')
    ax.set_xlim([ 0, N])
    ax.set_ylim([-0.5, 0.5])
    cmap = get_cmap(N)
    for i in range(N):
        rect = plt.Rectangle((i, -0.5), 1, 1, facecolor=cmap(i))
        ax.add_artist(rect)
    ax.set_yticks([])
    plt.show()

if __name__=='__main__':
    main()
已经测试过Python 2.7和matplotlib 1.5以及Python 3.5和matplotlib 2.0,一切正常。
for X,Y in data:
   scatter(X, Y, c=numpy.random.rand(3,))
color=(random.uniform(0, 1), random.uniform(0, 1), random.uniform(0, 1))。 - azzamsascatter(X,Y, c=numpy.random.rand(len(X),3) - Qualia进一步阐述 @john-mee 的答案,如果您具有任意长度的数据但不需要完全独特的颜色:
对于 Python 2:
from itertools import cycle
cycol = cycle('bgrcmk')

for X,Y in data:
    scatter(X, Y, c=cycol.next())
对于Python 3:
from itertools import cycle
cycol = cycle('bgrcmk')

for X,Y in data:
    scatter(X, Y, c=next(cycol))
这种方法的优点是颜色易于控制且长度较短。
有一段时间,我非常烦恼于matplotlib不能生成随机颜色的colormap,因为这是分割和聚类任务中常见的需要。
仅仅生成随机颜色可能会得到一些过于明亮或者过于暗淡的颜色,使得可视化变得困难。此外,通常我们需要第一个或最后一个颜色为黑色,代表背景或离群值。所以我为了我的日常工作编写了一个小函数。
以下是它的行为:
new_cmap = rand_cmap(100, type='bright', first_color_black=True, last_color_black=False, verbose=True)

然后,您只需将 new_cmap 用作matplotlib上的自定义颜色地图:
ax.scatter(X,Y, c=label, cmap=new_cmap, vmin=0, vmax=num_labels)
代码在这里:
def rand_cmap(nlabels, type='bright', first_color_black=True, last_color_black=False, verbose=True):
    """
    Creates a random colormap to be used together with matplotlib. Useful for segmentation tasks
    :param nlabels: Number of labels (size of colormap)
    :param type: 'bright' for strong colors, 'soft' for pastel colors
    :param first_color_black: Option to use first color as black, True or False
    :param last_color_black: Option to use last color as black, True or False
    :param verbose: Prints the number of labels and shows the colormap. True or False
    :return: colormap for matplotlib
    """
    from matplotlib.colors import LinearSegmentedColormap
    import colorsys
    import numpy as np


    if type not in ('bright', 'soft'):
        print ('Please choose "bright" or "soft" for type')
        return

    if verbose:
        print('Number of labels: ' + str(nlabels))

    # Generate color map for bright colors, based on hsv
    if type == 'bright':
        randHSVcolors = [(np.random.uniform(low=0.0, high=1),
                          np.random.uniform(low=0.2, high=1),
                          np.random.uniform(low=0.9, high=1)) for i in xrange(nlabels)]

        # Convert HSV list to RGB
        randRGBcolors = []
        for HSVcolor in randHSVcolors:
            randRGBcolors.append(colorsys.hsv_to_rgb(HSVcolor[0], HSVcolor[1], HSVcolor[2]))

        if first_color_black:
            randRGBcolors[0] = [0, 0, 0]

        if last_color_black:
            randRGBcolors[-1] = [0, 0, 0]

        random_colormap = LinearSegmentedColormap.from_list('new_map', randRGBcolors, N=nlabels)

    # Generate soft pastel colors, by limiting the RGB spectrum
    if type == 'soft':
        low = 0.6
        high = 0.95
        randRGBcolors = [(np.random.uniform(low=low, high=high),
                          np.random.uniform(low=low, high=high),
                          np.random.uniform(low=low, high=high)) for i in xrange(nlabels)]

        if first_color_black:
            randRGBcolors[0] = [0, 0, 0]

        if last_color_black:
            randRGBcolors[-1] = [0, 0, 0]
        random_colormap = LinearSegmentedColormap.from_list('new_map', randRGBcolors, N=nlabels)

    # Display colorbar
    if verbose:
        from matplotlib import colors, colorbar
        from matplotlib import pyplot as plt
        fig, ax = plt.subplots(1, 1, figsize=(15, 0.5))

        bounds = np.linspace(0, nlabels, nlabels + 1)
        norm = colors.BoundaryNorm(bounds, nlabels)

        cb = colorbar.ColorbarBase(ax, cmap=random_colormap, norm=norm, spacing='proportional', ticks=None,
                                   boundaries=bounds, format='%1i', orientation=u'horizontal')

    return random_colormap
这个项目也在Github上: https://github.com/delestro/rand_cmap
xrange替换为range以实现Python 3兼容性,通常您会希望将False作为verbose传递。(还有为什么没有pypi发布?) - user202729当数据集少于9个时:
colors = "bgrcmykw"
color_index = 0

for X,Y in data:
    scatter(X,Y, c=colors[color_index])
    color_index += 1
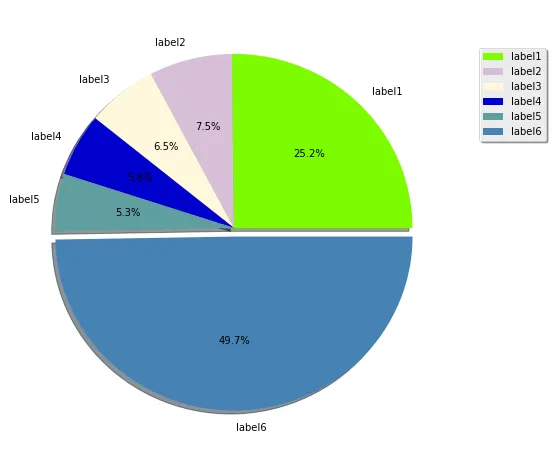
由于问题是 如何在matplotlib中生成随机颜色?,并且我正在寻找有关 饼图 的答案,因此我认为值得在这里(针对 饼图)提供一个答案。
import numpy as np
from random import sample
import matplotlib.pyplot as plt
import matplotlib.colors as pltc
all_colors = [k for k,v in pltc.cnames.items()]
fracs = np.array([600, 179, 154, 139, 126, 1185])
labels = ["label1", "label2", "label3", "label4", "label5", "label6"]
explode = ((fracs == max(fracs)).astype(int) / 20).tolist()
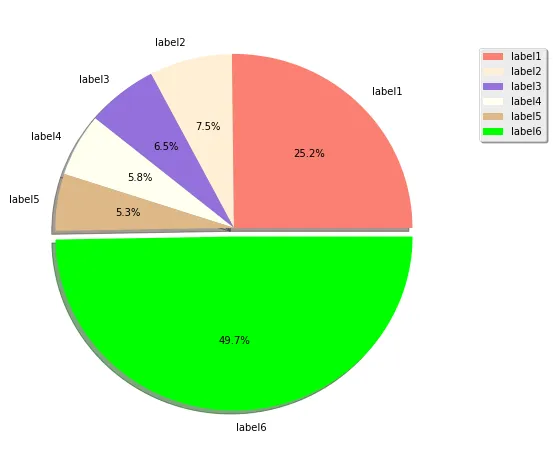
for val in range(2):
colors = sample(all_colors, len(fracs))
plt.figure(figsize=(8,8))
plt.pie(fracs, labels=labels, autopct='%1.1f%%',
shadow=True, explode=explode, colors=colors)
plt.legend(labels, loc=(1.05, 0.7), shadow=True)
plt.show()
输出
以下是 Ali 回答的更简洁版本,每个图表都给出一个明显的颜色:
import matplotlib.pyplot as plt

N = len(data)
cmap = plt.cm.get_cmap("hsv", N+1)
for i in range(N):
    X,Y = data[i]
    plt.scatter(X, Y, c=cmap(i))
根据Ali和Champitoad的答案:
如果你想尝试不同的调色板,可以用几行代码实现:
cmap=plt.cm.get_cmap(plt.cm.viridis, 143)
143是你要采样的颜色数量。
我选择了143,因为整个色图范围都在这里发挥作用。你可以每次迭代采样第n个颜色,以获得色图效果。
n=20
for i,(x,y) in enumerate(points):
    plt.scatter(x, y, c=cmap(n*i))
# generate random colors
colors_ = lambda n: list(map(lambda i: "#" + "%06x" % random.randint(0, 0xFFFFFF),range(n)))

fig = plt.figure()
fig.subplots_adjust(hspace=0.4, wspace=0.4)

# how many random colors to generate?
colors = colors_(6)
for i,color in zip(range(1, 7), colors):
    ax = fig.add_subplot(2, 3, i)
    ax.text(0.5, 0.5, str((2, 3, i)),
           fontsize=18, ha='center', color=color)
输出

改进答案https://dev59.com/C2Uq5IYBdhLWcg3wMNcK#14720445以适用于Python3。那段代码有时会生成大于1的数字,导致matplotlib出错。
for X,Y in data:
   scatter(X, Y, c=numpy.random.random(3))
distinctifyPython库:https://dev59.com/pHRB5IYBdhLWcg3w6bUD#68414642 - user202729