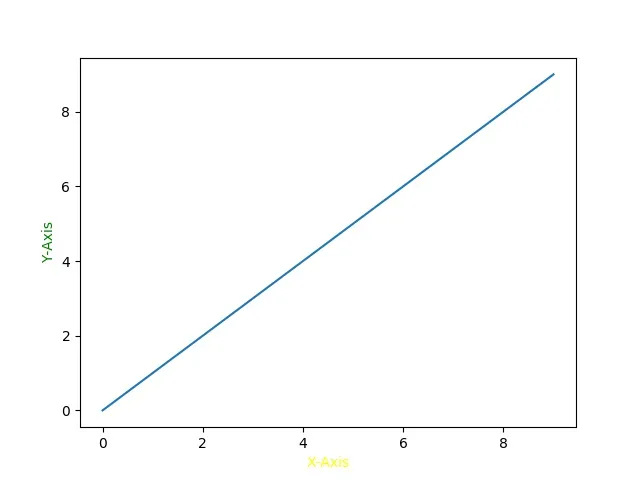
如何更改matplotlib图表的颜色?现在标题是黑色的,但其他文本是灰色的。我正在使用Pandas绘制Hexbin图表。我已经尝试过:
从http://matplotlib.org/users/customizing.html上我了解到,但它并没有起作用。
matplotlib.rcParams.update({'text.color': 'black'})
从http://matplotlib.org/users/customizing.html上我了解到,但它并没有起作用。
import matplotlib.pyplot as plt
import matplotlib
matplotlib.style.use('ggplot')
font = {'family' : 'normal',
        'weight' : 'bold',
        'size'   : 22}
matplotlib.rc('font', **font)

t = pessoas.plot.hexbin(x='qteViagens',y='qteDestUnicos',cmap=plt.cm.jet,gridsize=20,norm=matplotlib.colors.LogNorm(),colorbar=False)
t.set_xlabel('Number of Trips in Period')
t.set_ylabel('Number of Unique Destinations')
t.set_title('Number of Users')
