我已经完成了多元线性回归。我尝试用这个命令绘制它。
layout(matrix(c(1,2,3,4),2,2))
plot(fit_ec_urban_franchise)
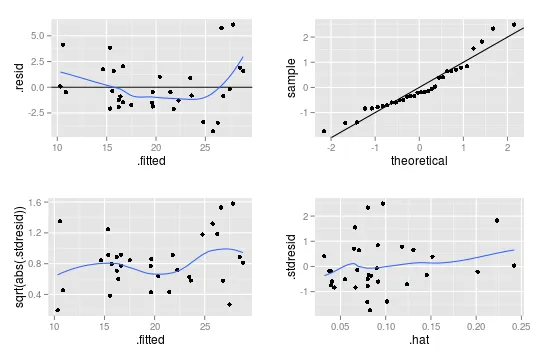
接下来我有4个图形:'残差-拟合值图','标准化残差-拟合值图','正态 Q-Q 图' 和 '残差杠杆值图'。
是否可以使用ggplot2将这4个图形合并成一个图形呢?
library(ggplot2)
library(gridExtra)

mod <- lm(mpg ~ wt + cyl, data = mtcars)

p1 <- qplot(.fitted, .resid, data = mod) +
  geom_hline(yintercept = 0) +
  geom_smooth(se = FALSE)

p2 <- qplot(sample =.stdresid, data = mod, stat = "qq") + geom_abline()

p3 <- qplot(.fitted, sqrt(abs(.stdresid)), data = mod) + geom_smooth(se = FALSE)

p4 <- qplot(.hat, .stdresid, data = mod) + geom_smooth(se = FALSE)


grid.arrange(p1,p2,p3,p4)
geom_smooth: method="auto" and size of largest group is <1000, so using loess. Use 'method = x' to change the smoothing method. Error: stat_smooth requires the following missing aesthetics: x, y. - jjjjjjj jjjjjjjmethod=loess;如果需要,请在geom_smooth中更改它,但这样可以工作。第二个意味着您的数据或代码存在问题,因为它找不到x和y;要么您没有将任何内容映射到绘图的aes()中的x和y,要么您的数据出现了某些损坏。 - scoa
autoplot.lm函数的软件包,例如http://www.inside-r.org/packages/cran/eeptools/docs/autoplot.lm。 - scoa