我有一些代码,使用matplotlib的scatter和tight_layout来生成3D散点图,请看下面简化的代码:
import numpy as np
import matplotlib.pyplot as plt
from mpl_toolkits.mplot3d import proj3d

fig = plt.figure()
ax = fig.gca(projection='3d')

N = 100
x = np.random.random(N)
y = np.random.random(N)
z = np.random.random(N)

ax.scatter(x, y, z)
plt.tight_layout()  # <-- Without this, everything is fine
plt.savefig('scatter.png')
在matplotlib 2.2.3中,这将生成如下图所示的图形:
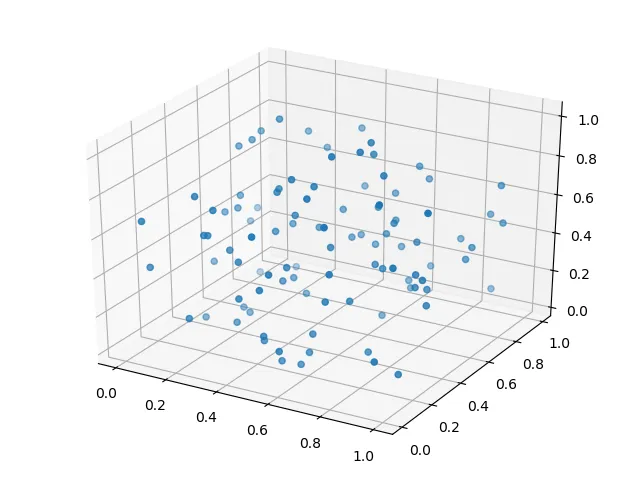 。
。旧版中也会生成类似的输出,至少可以追溯到1.5.1。但使用新版本3.0.0时,在
plt.tight_layout()上出了点问题,输出如下: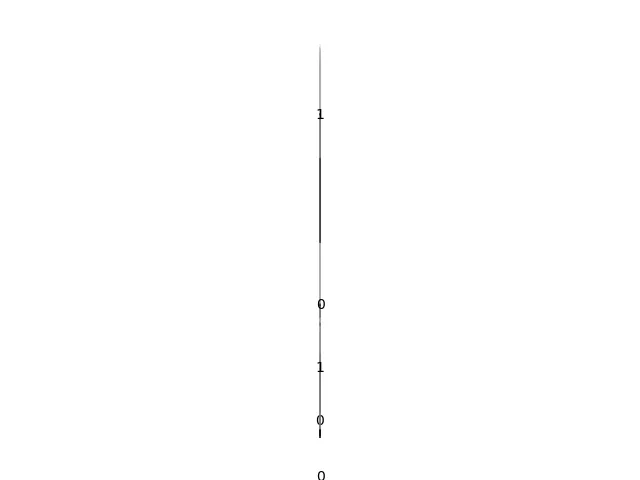 。
。对应的警告是:
有人可能会认为在老版本中使用没有参数的.../matplotlib/tight_layout.py:177: UserWarning: The left and right margins cannot be made large enough to accommodate all axes decorations
tight_layout并不总能使边距变窄,因此应该在首次使用3D绘图时避免使用tight_layout。但是,通过手动调整tight_layout的参数,它(已经)是一种修剪3D图边缘的不错方法。我猜这可能是matplotlib的一个bug,但也许他们进行了一些有意的更改我还没有理解。如果您有任何有关修复的指示,将不胜感激。
figsize不等同于tight_layout。此外,我已经在我的实际代码中设置了figsize,因为我关心最终图像的精确像素大小。 - jmd_dk