matplotlib中3D散点图上方的网格线

3

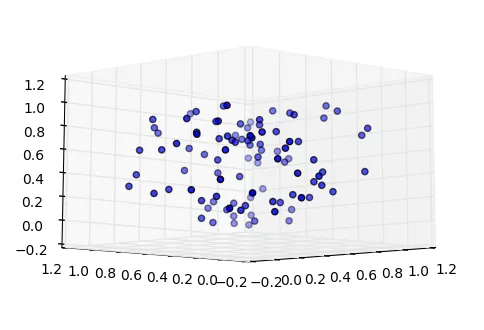
在使用matplotlib制作3D散点图时,我似乎无法控制坐标轴是在图形上方还是下方。例如,如果ax1.elev < 0,则以下代码将始终使x和y轴在图形上方。

import numpy as np
import matplotlib.pyplot as plt
from mpl_toolkits.mplot3d import axes3d

fig = plt.figure('Test')
X = np.random.rand(1,100)
Y = np.random.rand(1,100)
Z = np.random.rand(1,100)

ax1 = fig.add_subplot(111, projection = '3d')

ax1.scatter(X,Y,Z)
ax1.view_init(-10,45)

即使ax1.elev < 0,是否有可能强制x和y轴以及网格线和平面位于绘图下方?

1个回答

3

我以这个问题的代码为例(感谢crayzeewulf)。除了z轴外,我们也可以对x轴和y轴进行操作。

import numpy as np
import matplotlib.pyplot as plt
from mpl_toolkits.mplot3d import axes3d

fig = plt.figure('Test')
X = np.random.rand(1,100)
Y = np.random.rand(1,100)*10
Z = np.random.rand(1,100)

ax1 = fig.add_subplot(111, projection = '3d')

ax1.scatter(X,Y,Z)
ax1.view_init(-10,45)

tmp_planes = ax1.zaxis._PLANES 
ax1.xaxis._PLANES = ( tmp_planes[3], tmp_planes[2], 
                     tmp_planes[1], tmp_planes[0], 
                     tmp_planes[5], tmp_planes[4])

ax1.yaxis._PLANES = ( tmp_planes[3], tmp_planes[2], 
                     tmp_planes[1], tmp_planes[0], 
                     tmp_planes[5], tmp_planes[4])

view_1 = (25, -135)
view_2 = (-10, 45)
init_view = view_2
ax1.view_init(*init_view)

Change_axes_pos


网页内容由stack overflow 提供, 点击上面的
可以查看英文原文,
原文链接