2个回答
15
我需要类似的东西:在两侧绘制z轴。感谢@crayzeewulf的答案,我得到了以下解决方法(适用于左、右或两侧):
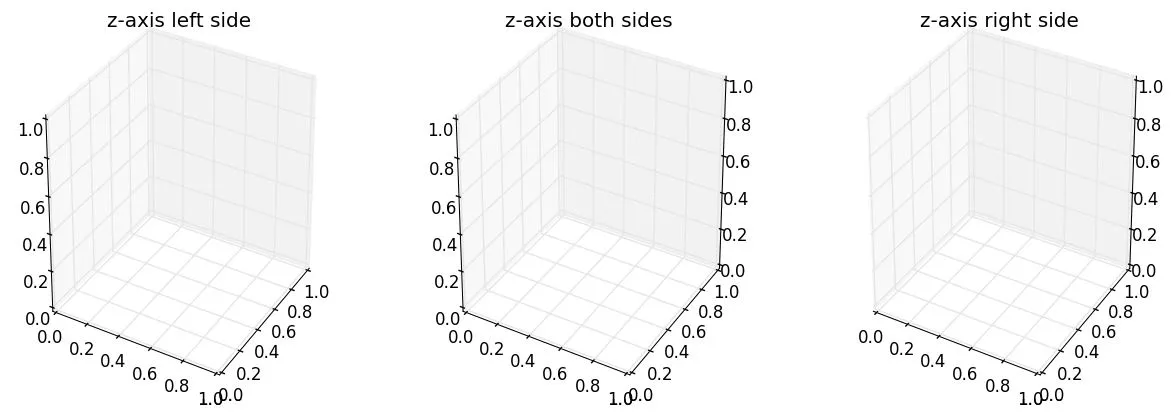
首先按需绘制3D图形,然后在调用show()之前,用一个包装器类将Axes3D包装起来,该类简单地重写draw()方法。
这个包装器类只是设置了一些功能的可见性为False,然后绘制自身,并使用修改后的PLANES绘制z轴。这个包装器类允许您在左侧、右侧或两侧绘制z轴。
import matplotlib
matplotlib.use('QT4Agg')
import matplotlib.pyplot as plt
from mpl_toolkits.mplot3d import axes3d

class MyAxes3D(axes3d.Axes3D):

    def __init__(self, baseObject, sides_to_draw):
        self.__class__ = type(baseObject.__class__.__name__,
                              (self.__class__, baseObject.__class__),
                              {})
        self.__dict__ = baseObject.__dict__
        self.sides_to_draw = list(sides_to_draw)
        self.mouse_init()

    def set_some_features_visibility(self, visible):
        for t in self.w_zaxis.get_ticklines() + self.w_zaxis.get_ticklabels():
            t.set_visible(visible)
        self.w_zaxis.line.set_visible(visible)
        self.w_zaxis.pane.set_visible(visible)
        self.w_zaxis.label.set_visible(visible)

    def draw(self, renderer):
        # set visibility of some features False
        self.set_some_features_visibility(False)
        # draw the axes
        super(MyAxes3D, self).draw(renderer)
        # set visibility of some features True.
        # This could be adapted to set your features to desired visibility,
        # e.g. storing the previous values and restoring the values
        self.set_some_features_visibility(True)

        zaxis = self.zaxis
        draw_grid_old = zaxis.axes._draw_grid
        # disable draw grid
        zaxis.axes._draw_grid = False

        tmp_planes = zaxis._PLANES

        if 'l' in self.sides_to_draw :
            # draw zaxis on the left side
            zaxis._PLANES = (tmp_planes[2], tmp_planes[3],
                             tmp_planes[0], tmp_planes[1],
                             tmp_planes[4], tmp_planes[5])
            zaxis.draw(renderer)
        if 'r' in self.sides_to_draw :
            # draw zaxis on the right side
            zaxis._PLANES = (tmp_planes[3], tmp_planes[2],
                             tmp_planes[1], tmp_planes[0],
                             tmp_planes[4], tmp_planes[5])
            zaxis.draw(renderer)

        zaxis._PLANES = tmp_planes

        # disable draw grid
        zaxis.axes._draw_grid = draw_grid_old

def example_surface(ax):
    """ draw an example surface. code borrowed from http://matplotlib.org/examples/mplot3d/surface3d_demo.html """
    from matplotlib import cm
    import numpy as np
    X = np.arange(-5, 5, 0.25)
    Y = np.arange(-5, 5, 0.25)
    X, Y = np.meshgrid(X, Y)
    R = np.sqrt(X**2 + Y**2)
    Z = np.sin(R)
    surf = ax.plot_surface(X, Y, Z, rstride=1, cstride=1, cmap=cm.coolwarm, linewidth=0, antialiased=False)

if __name__ == '__main__':
    fig = plt.figure(figsize=(15, 5))
    ax = fig.add_subplot(131, projection='3d')
    ax.set_title('z-axis left side')
    ax = fig.add_axes(MyAxes3D(ax, 'l'))
    example_surface(ax) # draw an example surface
    ax = fig.add_subplot(132, projection='3d')
    ax.set_title('z-axis both sides')
    ax = fig.add_axes(MyAxes3D(ax, 'lr'))
    example_surface(ax) # draw an example surface
    ax = fig.add_subplot(133, projection='3d')
    ax.set_title('z-axis right side')
    ax = fig.add_axes(MyAxes3D(ax, 'r'))
    example_surface(ax) # draw an example surface
    plt.show()
- wolfrevo
4
11
正如楼主在下面的评论中指出的那样,下面提出的方法没有为原始问题提供足够的答案。
正如这个注释中提到的那样,在axis3d中有许多硬编码的值使得定制其行为变得困难。因此,我认为在当前的API中没有很好的方法来做到这一点。您可以通过修改zaxis的_PLANES参数来“破解”它,如下所示:
tmp_planes = ax.zaxis._PLANES
ax.zaxis._PLANES = ( tmp_planes[2], tmp_planes[3],
                     tmp_planes[0], tmp_planes[1],
                     tmp_planes[4], tmp_planes[5])
view_1 = (25, -135)
view_2 = (25, -45)
init_view = view_2
ax.view_init(*init_view)
现在,无论你如何旋转图形(只要正z方向指向上方),z轴始终位于图形的左侧。但是,x轴和y轴将保持翻转状态。您可以使用
_PLANES进行调整,并可能能够获得所有轴的所需行为,但这可能会在未来版本的matplotlib中失效。- crayzeewulf
5
非常感谢你,crayzeewulf。有点奇怪,我能够让它工作,但是它的行为不像预期的那样。当我在没有你的修改的情况下运行脚本时,z轴在左侧。当我实施了你的修改后,z轴仍然停留在左侧。我改变了ax.zaxis._PLANES=(tmp[0],tmp[1],tmp[2],tmp[3],tmp[4],tmp[5])的顺序,它将轴移动到了右侧(我想要的)。看起来我只是重置了相同的ax.zaxis._PLANES值,但却实现了不同的结果。无论如何,再次感谢,这正是我想要的,我很感激。 - Blink
糟糕,我搞错了。为了改变轴,我使用了ax.zaxis._PLANES=(tmp[1],tmp[2],tmp[3],tmp[4],tmp[5],tmp[0])。这个方法起作用了;但是,我刚刚意识到它也会移动平面上的水平/垂直线。你可以在这里看到(http://i.imagebanana.com/img/vpcs6af2/Selection_005.png),后轴平面没有水平线,但前轴平面有。有没有网站描述._PLANES是如何定义的?我已经尝试了大约50种不同的组合,以找出我想要的结果(右侧垂直轴和后方水平线)。 - Blink
1跟进我的上一条评论。我刚刚完成了一个暴力测试,运行了所有[0,1,2,3,4,5]的tmp_planes排列组合,总共720种不同的排列方式。没有一个得到了正确的数字。我想我可能会被这个问题困扰住。 - Blink
William,很抱歉,无论怎样排列都不能保持 z 轴在右侧而不破坏图的某些其他特性。调整
_PLANES 确实很丑陋。确定轴位置的机制在 matplotlib 的名为 axis3d.py 的文件中实现。从这段代码可以看出它目前并不是非常灵活,但您可能可以通过阅读此文件了解有关如何使用 _PLANES 的更多信息。您可能可以对此文件中的 Axis 类进行 Monkey patch 以使其按照您的要求工作。但再次强调,这是丑陋的。 - crayzeewulf1@crayzeewulf:感谢你提出了使用飞机的想法。在学习了一些它们的工作原理后,我发布了一个解决方案,不会破坏其他功能,并避免了对源代码进行打补丁的操作。 - wolfrevo
网页内容由stack overflow 提供, 点击上面的可以查看英文原文,
原文链接
原文链接
fig后添加绘图时,我得到的结果如下:http://imgur.com/VJLTTTH - pyCthonax.zaxis._axinfo['juggled'] = (0,2,1)- sherdim