当进行分面时,
annotation_custom会在所有面板中绘制注释。因此,
annotation-custom可能不是最佳选择。这里有两种尝试使用
grid软件包中的函数。它们都不是完全自动化的,但您可以尝试调整其中一种来满足您的需求。它们设置一个2 X 2网格,并使用
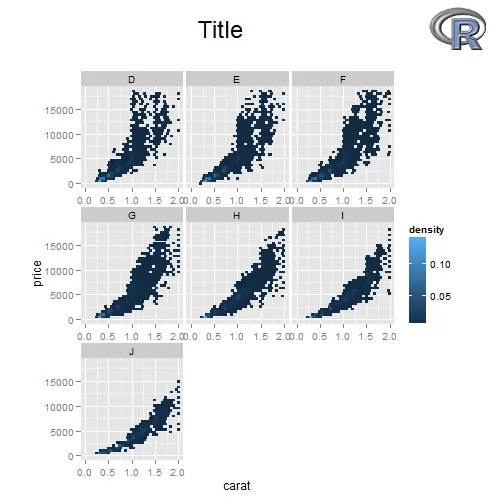
grid.show.layout()命令显示。在第一个图中,分面绘图填充整个面板,右上角视口包含标志。恰好在您的图中,有清晰的空间可用于放置标志。请注意,
layout.pos.row和
layout.pos.col给出了布局中视口占用的行和列。
library(ggplot2)
library(png)
library(grid)
img <- readPNG(system.file("img", "Rlogo.png", package="png"))
g <- rasterGrob(img)
size = unit(2, "cm")
d <- ggplot(diamonds, aes(carat, price)) +
xlim(0, 2) +
stat_binhex(na.rm = TRUE) +
labs(title = 'Title') +
theme(aspect.ratio = 1) +
facet_wrap(~ color, scales = "free_x")
heights = unit.c(size, unit(1, "npc") - size)
widths = unit.c(unit(1, "npc") - size, size)
lo = grid.layout(2, 2, widths = widths, heights = heights)
grid.show.layout(lo)
grid.newpage()
pushViewport(viewport(layout = lo))
pushViewport(viewport(layout.pos.row=1:2, layout.pos.col = 1:2))
print(d, newpage=FALSE)
popViewport()
pushViewport(viewport(layout.pos.row=1, layout.pos.col = 2))
print(grid.draw(g), newpage=FALSE)
popViewport()
popViewport()
g = grid.grab()
grid.newpage()
grid.draw(g)
标题与标志不完全对齐。一种解决方法是从ggplot中删除标题,绘制一个包含标题的单独的textGrob,然后将textGrob定位在包含标志的视口旁边的左上角视口中。
img <- readPNG(system.file("img", "Rlogo.png", package="png"))
g <- rasterGrob(img)
size = unit(2, "cm")
d <- ggplot(diamonds, aes(carat, price)) +
xlim(0, 2) +
stat_binhex(na.rm = TRUE) +
theme(aspect.ratio = 1) +
facet_wrap(~ color, scales = "free_x")
title = textGrob("Title", gp = gpar(face = "bold", cex = 2))
heights = unit.c(size, unit(1, "npc") - size)
widths = unit.c(unit(1, "npc") - 1.5*size, size)
lo = grid.layout(2, 2, widths = widths, heights = heights)
grid.show.layout(lo)
grid.newpage()
pushViewport(viewport(layout = lo))
pushViewport(viewport(layout.pos.row=2, layout.pos.col = 1:2))
print(d, newpage=FALSE)
popViewport()
pushViewport(viewport(layout.pos.row=1, layout.pos.col = 2))
print(grid.draw(g), newpage=FALSE)
popViewport()
pushViewport(viewport(layout.pos.row=1, layout.pos.col = 1))
print(grid.draw(title), newpage=FALSE)
popViewport()
popViewport()
g = grid.grab()
grid.newpage()
grid.draw(g)
annotate_custom可以在外部工作。https://dev59.com/I2ct5IYBdhLWcg3wApCH#12417481 - user1317221_G