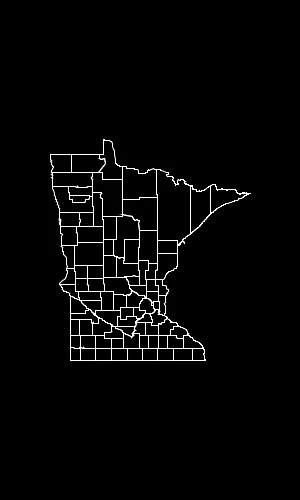
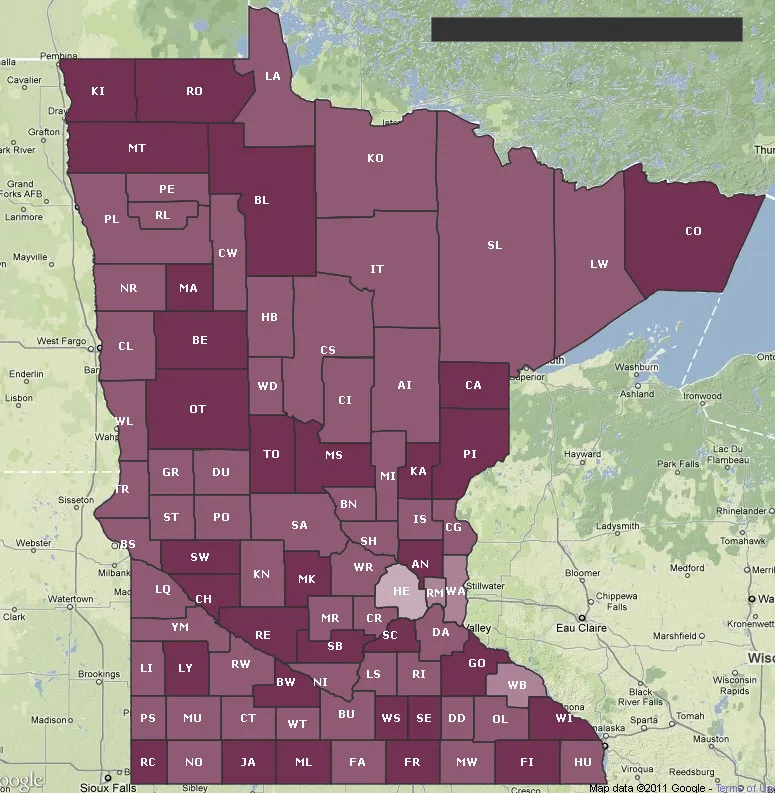
我使用Google Maps API创建了一个地图,突出显示了所有明尼苏达县。基本上,我使用一组经度/纬度坐标创建了县边界多边形。以下是生成的地图截图:
用户要求之一是能够将类似的地图作为图像嵌入到他们的PowerPoint/keynote幻灯片中。我找不到任何有用的Google Maps API,使我能够像原来一样保存我的自定义地图(如果你知道方法,请告诉我),所以我想应该在Java中使用Graphics2D进行绘制。
阅读有关将经度/纬度转换为X/Y坐标的公式后,我最终得到了以下代码:
private static final int    EARTH_RADIUS    = 6371;
private static final double FOCAL_LENGTH    = 500;

...

BufferedImage bi = new BufferedImage(WIDTH, HEIGHT, BufferedImage.TYPE_INT_RGB);
Graphics2D g = bi.createGraphics();

for (Coordinate coordinate : coordinates) {
    double latitude = Double.valueOf(coordinate.getLatitude());
    double longitude = Double.valueOf(coordinate.getLongitude());

    latitude = latitude * Math.PI / 180;
    longitude = longitude * Math.PI / 180;

    double x = EARTH_RADIUS * Math.sin(latitude) * Math.cos(longitude);
    double y = EARTH_RADIUS * Math.sin(latitude) * Math.sin(longitude);
    double z = EARTH_RADIUS * Math.cos(latitude);

    double projectedX = x * FOCAL_LENGTH / (FOCAL_LENGTH + z);
    double projectedY = y * FOCAL_LENGTH / (FOCAL_LENGTH + z);

    // scale the map bigger
    int magnifiedX = (int) Math.round(projectedX * 5);
    int magnifiedY = (int) Math.round(projectedY * 5);

    ...
    g.drawPolygon(...);
    ...
}
生成的地图与使用相同经度/纬度集合的Google Maps API生成的地图相似。然而,它看起来有点倾斜并且有些不一样,我不确定如何解决。
如何使县的形状看起来与上面由Google Maps API生成的地图完全一样?
非常感谢。
最终解决方案
我终于找到了解决方案,感谢@QuantumMechanic和@Anon。
这里使用墨卡托投影真正做到了。我使用Java地图投影库(Java Map Projection Library)来执行墨卡托投影的计算。
private static final int    IMAGE_WIDTH     = 1000;
private static final int    IMAGE_HEIGHT    = 1000;
private static final int    IMAGE_PADDING   = 50;

...

private List<Point2D.Double> convertToXY(List<Coordinate> coordinates) {
    List<Point2D.Double> xys = new ArrayList<Point2D.Double>();

    MercatorProjection projection = new MercatorProjection();

    for (Coordinate coordinate : coordinates) {
        double latitude = Double.valueOf(coordinate.getLatitude());
        double longitude = Double.valueOf(coordinate.getLongitude());

        // convert to radian
        latitude = latitude * Math.PI / 180;
        longitude = longitude * Math.PI / 180;

        Point2D.Double d = projection.project(longitude, latitude, new Point2D.Double());

        // shift by 10 to remove negative Xs and Ys
        // scaling by 6000 to make the map bigger
        int magnifiedX = (int) Math.round((10 + d.x) * 6000);
        int magnifiedY = (int) Math.round((10 + d.y) * 6000);

        minX = (minX == -1) ? magnifiedX : Math.min(minX, magnifiedX);
        minY = (minY == -1) ? magnifiedY : Math.min(minY, magnifiedY);

        xys.add(new Point2D.Double(magnifiedX, magnifiedY));
    }

    return xys;
}

...
通过使用生成的XY坐标,地图看起来是倒置的,这是因为我相信graphics2D的0,0从左上角开始。因此,我需要通过从图像高度中减去该值来反转Y轴,类似于这样:
...

Polygon polygon = new Polygon();

for (Point2D.Double point : xys) {
    int adjustedX = (int) (IMAGE_PADDING + (point.getX() - minX));

    // need to invert the Y since 0,0 starts at top left
    int adjustedY = (int) (IMAGE_HEIGHT - IMAGE_PADDING - (point.getY() - minY));

    polygon.addPoint(adjustedX, adjustedY);
}

...
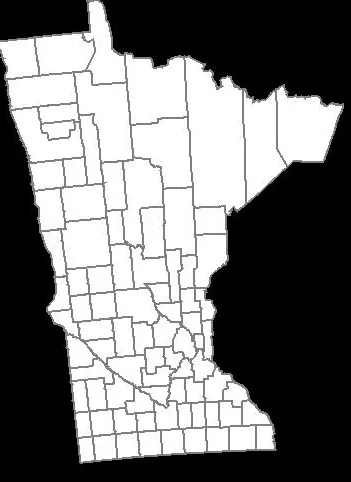
这是生成的地图:
非常完美!
更新 01-25-2013
以下是根据宽度和高度(以像素为单位)创建图像映射的代码。在这种情况下,我没有依赖Java Map Project Library,而是从中提取了相关公式并将其嵌入到我的代码中。与上面的代码示例相比,这使您更加控制地图生成,后者依赖于任意缩放值(上面的示例使用6000)。
public class MapService {
    // CHANGE THIS: the output path of the image to be created
    private static final String IMAGE_FILE_PATH = "/some/user/path/map.png";

    // CHANGE THIS: image width in pixel
    private static final int IMAGE_WIDTH_IN_PX = 300;

    // CHANGE THIS: image height in pixel
    private static final int IMAGE_HEIGHT_IN_PX = 500;

    // CHANGE THIS: minimum padding in pixel
    private static final int MINIMUM_IMAGE_PADDING_IN_PX = 50;

    // formula for quarter PI
    private final static double QUARTERPI = Math.PI / 4.0;

    // some service that provides the county boundaries data in longitude and latitude
    private CountyService countyService;

    public void run() throws Exception {
        // configuring the buffered image and graphics to draw the map
        BufferedImage bufferedImage = new BufferedImage(IMAGE_WIDTH_IN_PX,
                                                        IMAGE_HEIGHT_IN_PX,
                                                        BufferedImage.TYPE_INT_RGB);

        Graphics2D g = bufferedImage.createGraphics();
        Map<RenderingHints.Key, Object> map = new HashMap<RenderingHints.Key, Object>();
        map.put(RenderingHints.KEY_INTERPOLATION, RenderingHints.VALUE_INTERPOLATION_BICUBIC);
        map.put(RenderingHints.KEY_RENDERING, RenderingHints.VALUE_RENDER_QUALITY);
        map.put(RenderingHints.KEY_ANTIALIASING, RenderingHints.VALUE_ANTIALIAS_ON);
        RenderingHints renderHints = new RenderingHints(map);
        g.setRenderingHints(renderHints);

        // min and max coordinates, used in the computation below
        Point2D.Double minXY = new Point2D.Double(-1, -1);
        Point2D.Double maxXY = new Point2D.Double(-1, -1);

        // a list of counties where each county contains a list of coordinates that form the county boundary
        Collection<Collection<Point2D.Double>> countyBoundaries = new ArrayList<Collection<Point2D.Double>>();

        // for every county, convert the longitude/latitude to X/Y using Mercator projection formula
        for (County county : countyService.getAllCounties()) {
            Collection<Point2D.Double> lonLat = new ArrayList<Point2D.Double>();

            for (CountyBoundary countyBoundary : county.getCountyBoundaries()) {
                // convert to radian
                double longitude = countyBoundary.getLongitude() * Math.PI / 180;
                double latitude = countyBoundary.getLatitude() * Math.PI / 180;

                Point2D.Double xy = new Point2D.Double();
                xy.x = longitude;
                xy.y = Math.log(Math.tan(QUARTERPI + 0.5 * latitude));

                // The reason we need to determine the min X and Y values is because in order to draw the map,
                // we need to offset the position so that there will be no negative X and Y values
                minXY.x = (minXY.x == -1) ? xy.x : Math.min(minXY.x, xy.x);
                minXY.y = (minXY.y == -1) ? xy.y : Math.min(minXY.y, xy.y);

                lonLat.add(xy);
            }

            countyBoundaries.add(lonLat);
        }

        // readjust coordinate to ensure there are no negative values
        for (Collection<Point2D.Double> points : countyBoundaries) {
            for (Point2D.Double point : points) {
                point.x = point.x - minXY.x;
                point.y = point.y - minXY.y;

                // now, we need to keep track the max X and Y values
                maxXY.x = (maxXY.x == -1) ? point.x : Math.max(maxXY.x, point.x);
                maxXY.y = (maxXY.y == -1) ? point.y : Math.max(maxXY.y, point.y);
            }
        }

        int paddingBothSides = MINIMUM_IMAGE_PADDING_IN_PX * 2;

        // the actual drawing space for the map on the image
        int mapWidth = IMAGE_WIDTH_IN_PX - paddingBothSides;
        int mapHeight = IMAGE_HEIGHT_IN_PX - paddingBothSides;

        // determine the width and height ratio because we need to magnify the map to fit into the given image dimension
        double mapWidthRatio = mapWidth / maxXY.x;
        double mapHeightRatio = mapHeight / maxXY.y;

        // using different ratios for width and height will cause the map to be stretched. So, we have to determine
        // the global ratio that will perfectly fit into the given image dimension
        double globalRatio = Math.min(mapWidthRatio, mapHeightRatio);

        // now we need to readjust the padding to ensure the map is always drawn on the center of the given image dimension
        double heightPadding = (IMAGE_HEIGHT_IN_PX - (globalRatio * maxXY.y)) / 2;
        double widthPadding = (IMAGE_WIDTH_IN_PX - (globalRatio * maxXY.x)) / 2;

        // for each country, draw the boundary using polygon
        for (Collection<Point2D.Double> points : countyBoundaries) {
            Polygon polygon = new Polygon();

            for (Point2D.Double point : points) {
                int adjustedX = (int) (widthPadding + (point.getX() * globalRatio));

                // need to invert the Y since 0,0 starts at top left
                int adjustedY = (int) (IMAGE_HEIGHT_IN_PX - heightPadding - (point.getY() * globalRatio));

                polygon.addPoint(adjustedX, adjustedY);
            }

            g.drawPolygon(polygon);
        }

        // create the image file
        ImageIO.write(bufferedImage, "PNG", new File(IMAGE_FILE_PATH));
    }
}
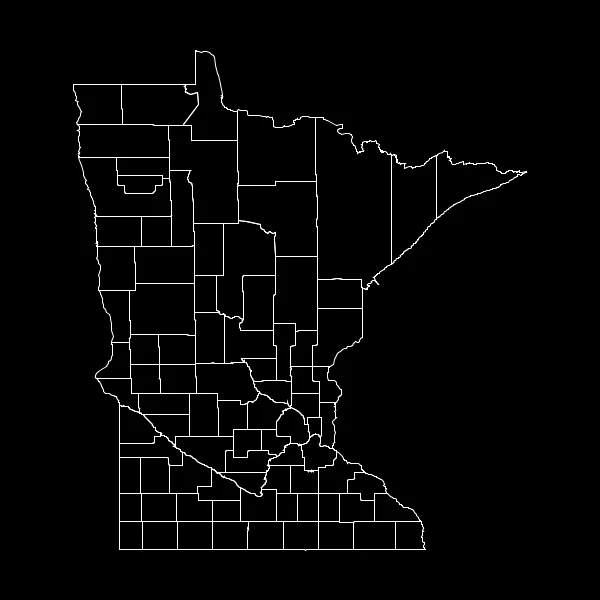
结果:图片宽度为600像素,图片高度为600像素,图片内边距为50像素
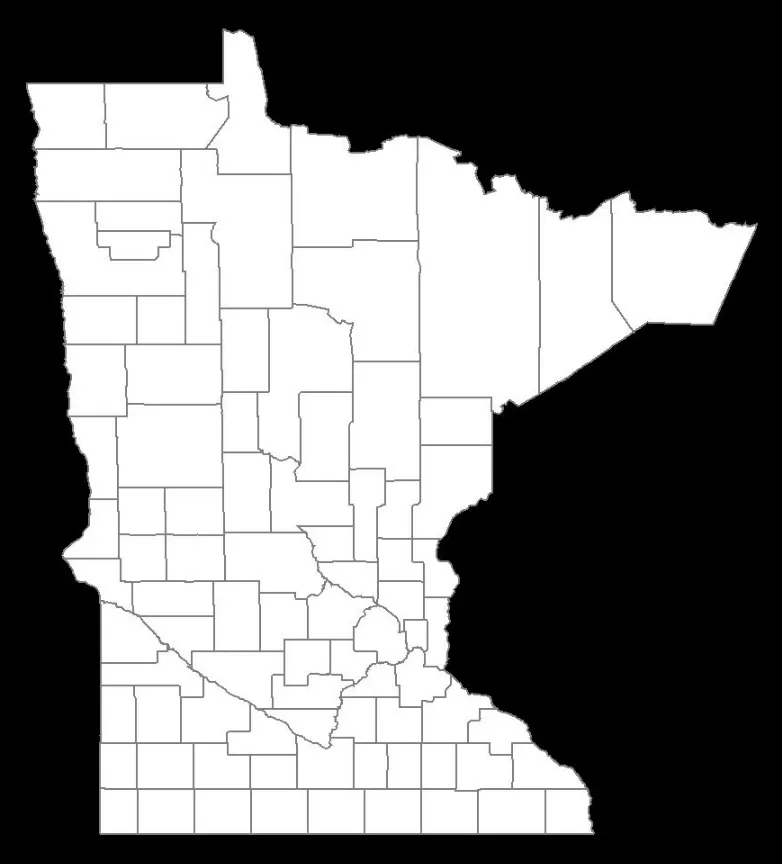
结果:图片宽度为300像素,图片高度为500像素,图片内边距为50像素