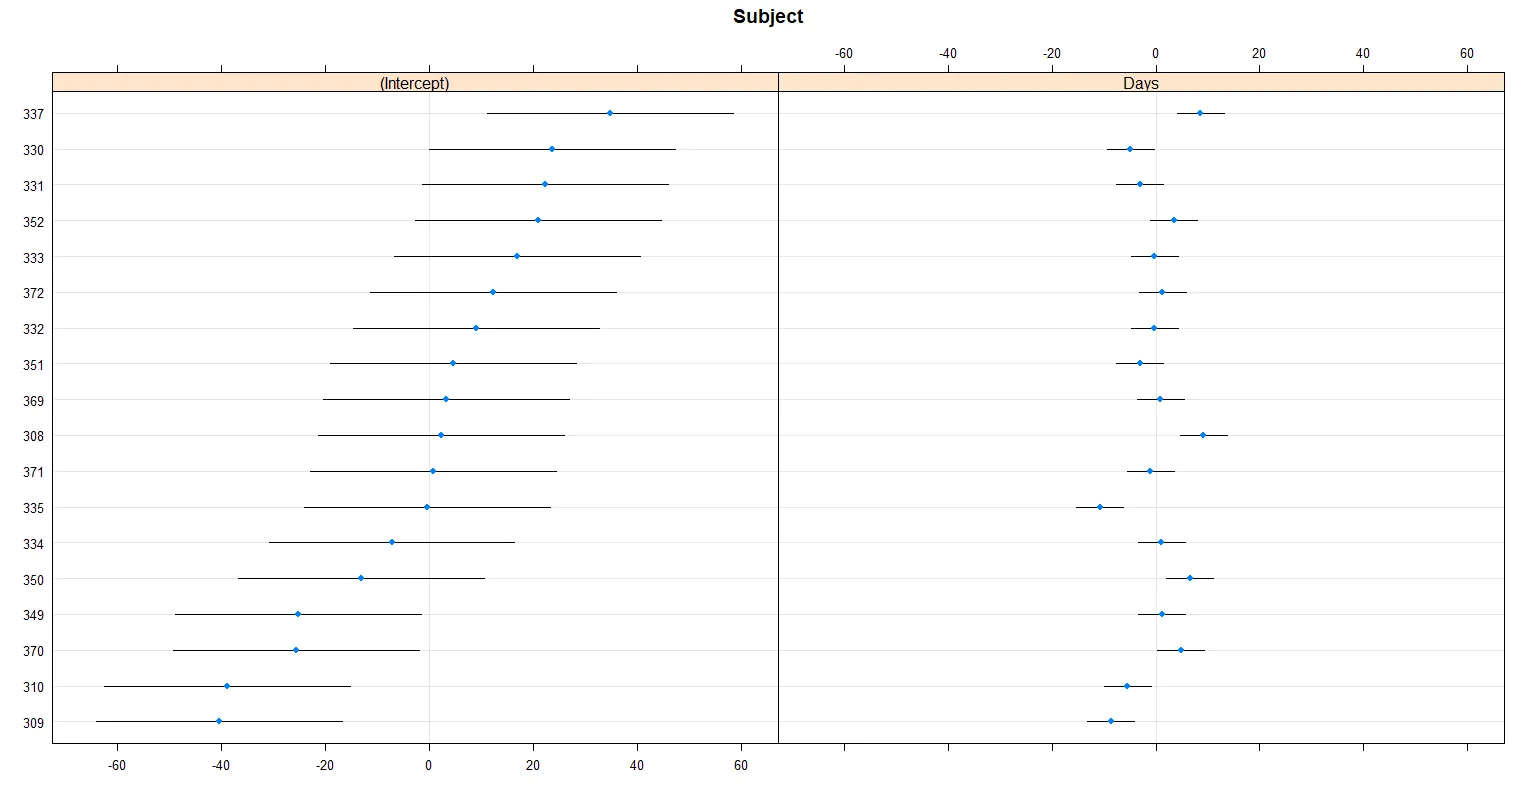
使用dotplot(ranef())绘制lmer随机效应的置信区间。

4
我想提取使用 dotplot(ranef()) 绘制的置信区间和截距值。我该如何做?
attach(sleepstudy)
library(lme4)
fm1 <- lmer(Reaction ~ Days + (Days | Subject), sleepstudy)
lattice::dotplot(ranef(fm1, condVar=TRUE))

enter image description here

我尝试探索列表对象 fm1,但找不到CI。


2
这里不需要使用 attach() (并且被认为是有害的)。 - Ben Bolker
1个回答

5
rr <- ranef(fm1)  ## condVar = TRUE has been the default for a while

使用as.data.frame函数:可以得到条件模式和标准偏差,从中计算出区间(严格来说,这不是“置信区间”,因为BLUPs/条件模式的值不是参数...)

dd <- as.data.frame(rr)
transform(dd, lwr = condval - 1.96*condsd, upr = condval + 1.96*condsd)

或者使用 broom.mixed::tidy

broom.mixed::tidy(m1, effects = "ran_vals", conf.int = TRUE)

broom.mixed::tidy()使用as.data.frame.ranef.mer() (也是由as.data.frame调用的方法)内部实现:该函数会提取?lme4::ranef中描述的相当复杂的数据结构,并以更加用户友好的格式提取条件模式和标准偏差:

如果‘condVar’为‘TRUE’,则‘"postVar"’属性是一个维度为j*j*k的数组(或者一列这样的数组)。该数组的第k个面是一个正定对称的j*j矩阵。如果模型中只有一个分组因素,则完整随机效应向量的方差-协方差矩阵,在模型参数和数据估计的条件下,将是块对角的。这个j*j矩阵是第k个对角块。有多个分组因素时,‘"postVar"’属性的面仍然是此条件方差-协方差矩阵的对角线块,但矩阵本身不再是块对角的。

在这个特定的情况中,要复制as.data.frame()中的condsd列,需要执行以下操作:

## get the 'postVar' attribute of the first (and only) RE term
aa <- attr(rr$Subject, "postVar")
## for each slice of the array, extract the diagonal;
##  transpose and drop dimensions;
##  take the square root
sqrt(c(t(apply(aa, 3, diag))))

您介意简要阐述一下 as.data.frame.ranef.mer 的作用,以从 attr(rr$Subject, 'postVar')(假定)中获取条件SD吗? - jay.sf
谢谢!这正是我在寻找的。 - Luis M. García
1
@jay.sf:这有帮助吗? - Ben Bolker
@BenBolker 是的,谢谢,非常好的回答 +1 - jay.sf

网页内容由stack overflow 提供, 点击上面的
可以查看英文原文,
原文链接