我有一个简短的R脚本,使用ggplot2绘制了几个直方图。如何根据直方图中最大频率(加上10%)自动设置直方图的最大y轴限制?
scale_y_continuous(limits= c(0,ymax*1.1)
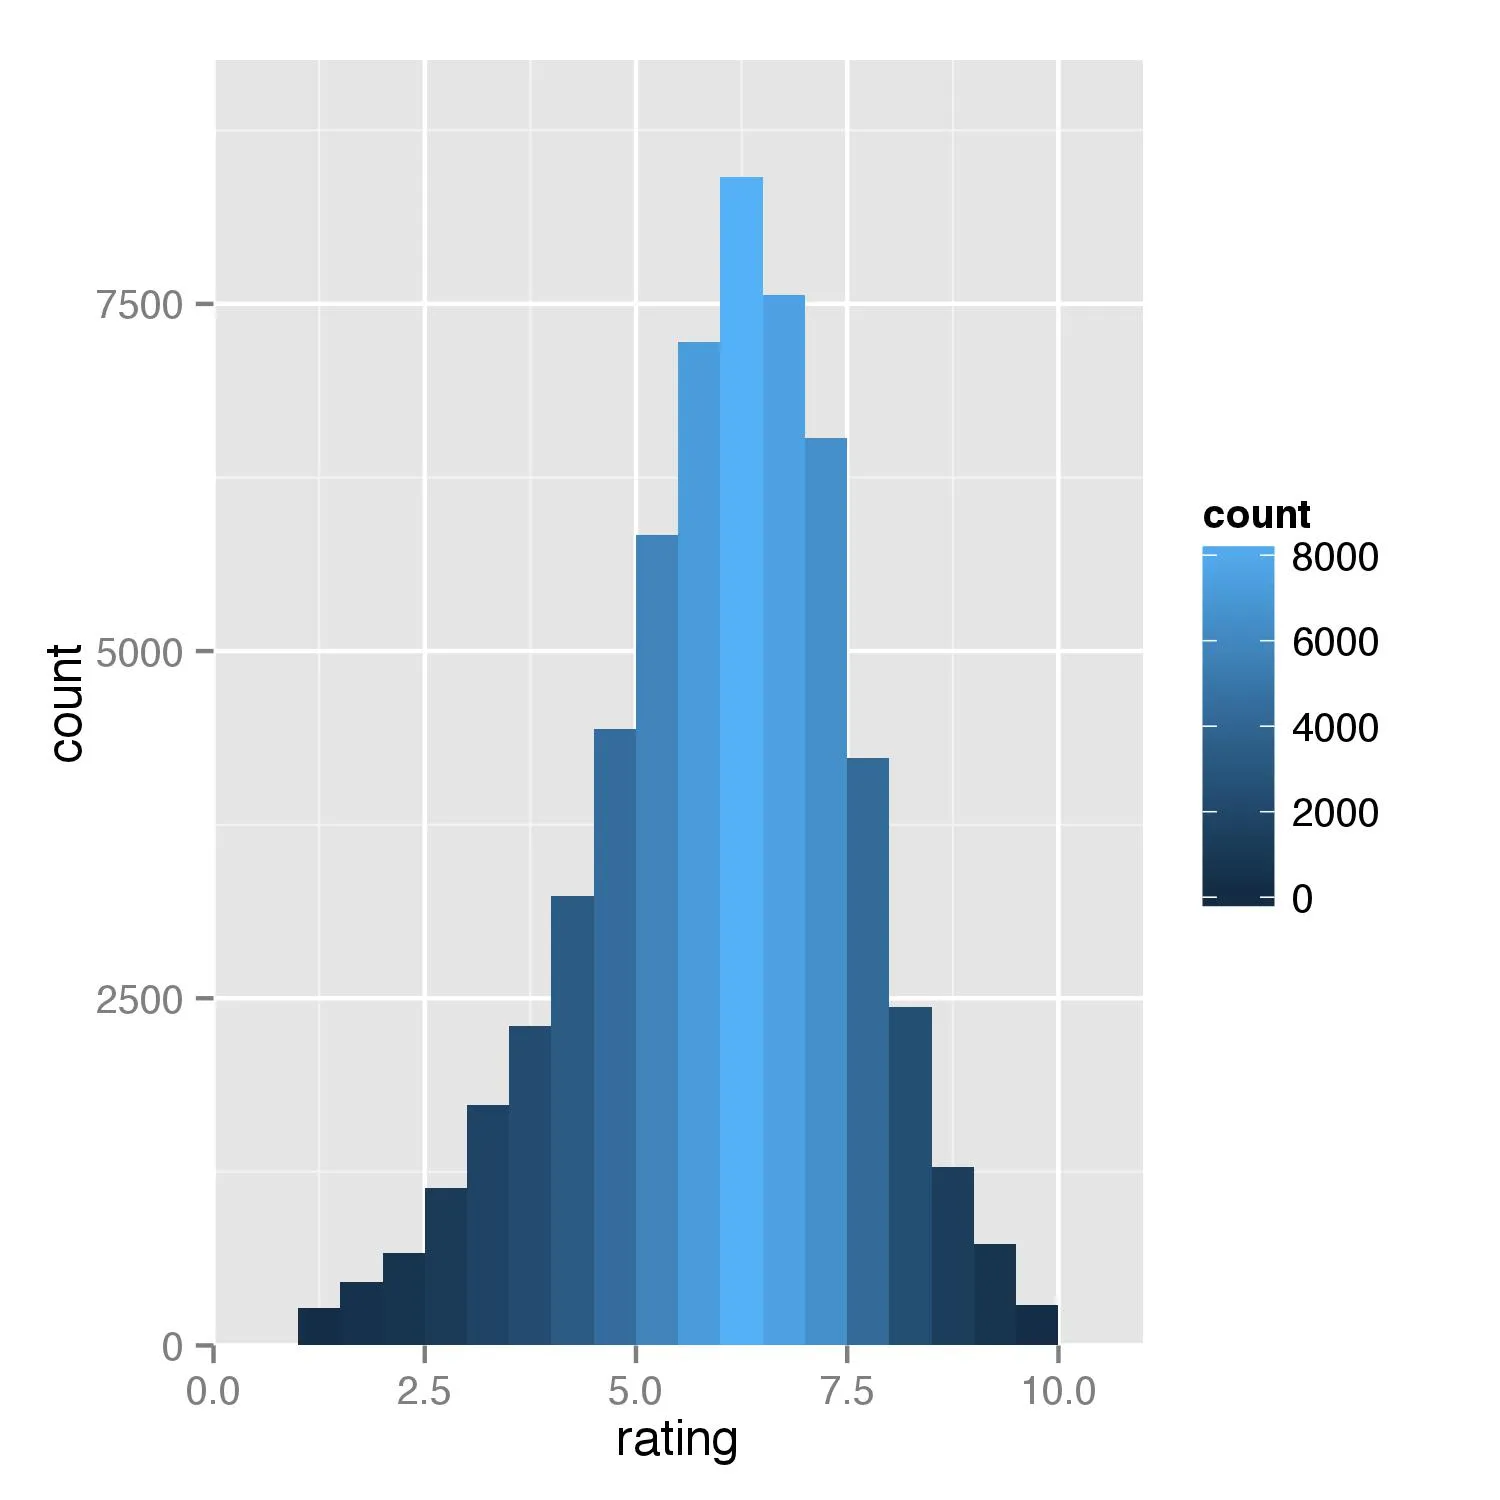
plot = ggplot(data, aes(myo_activity)) +
geom_histogram(binwidth=0.5, aes(fill=..count..))
plot + scale_x_continuous(expand = c(0,0), limits = c(30,90)) +
scale_y_continuous(expand = c(0,0), limits = c(0,140))