插值分类阈值

8

我一直在使用RStudio中的caret包中的gbm来查找故障发生的概率。

我使用Youden's J方法找到了最佳分类的阈值,为0.63。现在如何使用这个阈值呢?我认为最好的方法是将阈值某种方式纳入到caret的gbm模型中,以获得更准确的预测,然后再次在训练数据上运行该模型?目前默认值为0.5,我找不到明显的更新阈值的方法。

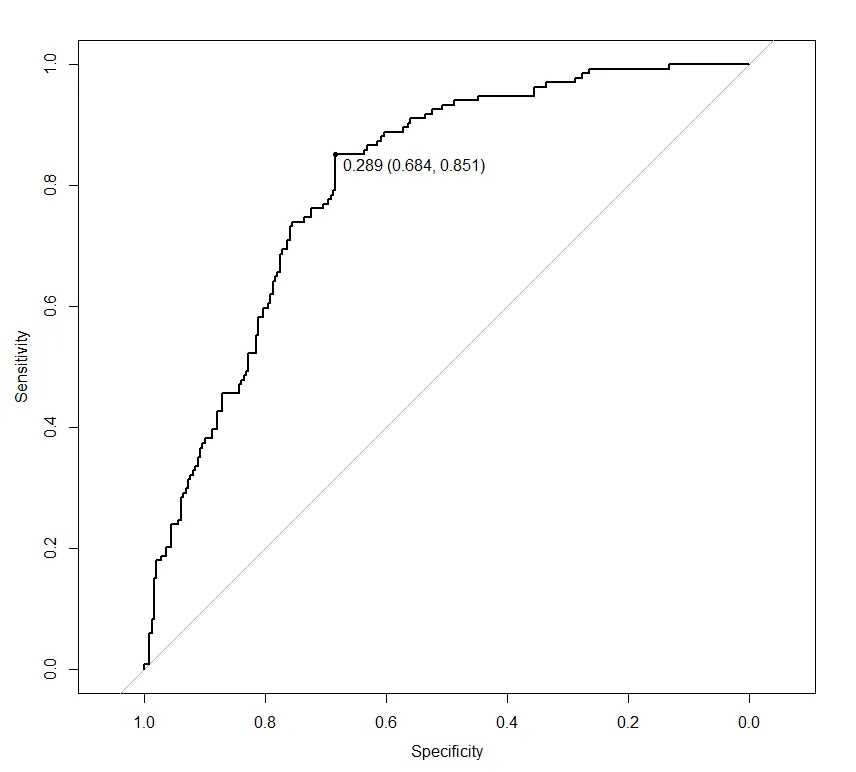
或者,阈值只是用于将测试数据的预测分成正确的类别吗?这似乎更直观,但是如何反映基于新阈值应更新的概率的ROC_AUC图的变化呢?

任何帮助都将不胜感激。谢谢。

编辑:我正在处理的完整代码如下:

  
library(datasets)
library(caret)
library(MLeval)
library(dplyr)

data(iris)
data <- as.data.frame(iris)

# create class
data$class <- ifelse(data$Species == "setosa", "yes", "no")

# split into train and test
train <- data %>% sample_frac(.70)
test <- data %>% sample_frac(.30)


# Set up control function for training
ctrl <- trainControl(method = "cv",
                     number = 5, 
                     returnResamp = 'none',
                     summaryFunction = twoClassSummary,
                     classProbs = T,
                     savePredictions = T,
                     verboseIter = F)

# Set up trainng grid - this is based on a hyper-parameter tune that was recently done
gbmGrid <-  expand.grid(interaction.depth = 10,
                        n.trees = 20000,                                          
                        shrinkage = 0.01,                                         
                        n.minobsinnode = 4) 


# Build a standard classifier using a gradient boosted machine
set.seed(5627)
gbm_iris <- train(class ~ .,
                   data = train,
                   method = "gbm",
                   metric = "ROC",
                   tuneGrid = gbmGrid,
                   verbose = FALSE,
                   trControl = ctrl)

# Calcuate best thresholds
caret::thresholder(gbm_iris, threshold = seq(.01,0.99, by = 0.01), final = TRUE, statistics = "all")

pred <- predict(gbm_iris, newdata = test, type = "prob")
roc <- evalm(data.frame(pred, test$class))


你是如何找到最佳阈值的? - missuse
我使用caretsthresholder函数找到了我的最佳阈值,如下所示:thres <- caret::thresholder(gbm, threshold = seq(.01,0.99, by = 0.01), final = TRUE, statistics = "all")。从中我使用Youden's J得出了一个值为0.63,这给了我最好的FPR,但也降低了TPR。 - SB21
请参见 https://stackoverflow.com/questions/65814703/r-can-carettrain-function-for-glmnet-cross-validate-auc-at-fixed-alpha-and-la/65868243#65868243。如果有不清楚的地方,请重写问题并包含可复现的示例,我会尽力回答。 - missuse
谢谢您的建议,我已经更新了帖子并添加了可重现的代码。您提供的链接非常有用,从中我了解到caret不支持将模型阈值从0.5更改。在R中,我应该使用哪个软件包来方便地更改gbm模型的阈值呢?更改模型中的阈值是否是最佳方法?谢谢。 - SB21
你的代码问题在于我们无法在SO上访问All_train.rds。你能否发布一个可重现的示例,其中包含内置数据集。您可以通过预测概率并手动设置阈值来更改caret中的预测阈值。 - missuse
显示剩余2条评论
1个回答

11
你的代码存在几个问题。我将使用mlbench中的PimaIndiansDiabetes数据集,因为它比iris数据集更适合。
首先,对于将数据拆分为训练集和测试集的代码:
train <- data %>% sample_frac(.70)
test <- data %>% sample_frac(.30)

这种方法不适用,因为训练集中出现的某些行也会出现在测试集中。

此外,避免使用函数名称作为对象名称,这将在长期运行中节省大量麻烦。

data(iris)
data <- as.data.frame(iris) #bad object name

举个例子:

library(caret)
library(ModelMetrics)
library(dplyr)
library(mlbench)

data(PimaIndiansDiabetes, package = "mlbench")

创建训练集和测试集,您可以使用基本的R sample 来采样行或 caret::createDataPartitioncreateDataPartition 更可取,因为它试图保持响应的分布。
set.seed(123)
ind <- createDataPartition(PimaIndiansDiabetes$diabetes, 0.7)


tr <- PimaIndiansDiabetes[ind$Resample1,]
ts <- PimaIndiansDiabetes[-ind$Resample1,]

这样,训练集中的行就不会出现在测试集中。

让我们创建模型:

ctrl <- trainControl(method = "cv",
                     number = 5, 
                     returnResamp = 'none',
                     summaryFunction = twoClassSummary,
                     classProbs = T,
                     savePredictions = T,
                     verboseIter = F)


gbmGrid <-  expand.grid(interaction.depth = 10,
                        n.trees = 200,                                          
                        shrinkage = 0.01,                                         
                        n.minobsinnode = 4) 

set.seed(5627)
gbm_pima <- train(diabetes ~ .,
                  data = tr,
                  method = "gbm", #use xgboost
                  metric = "ROC",
                  tuneGrid = gbmGrid,
                  verbose = FALSE,
                  trControl = ctrl)

创建一个阈值概率向量。
probs <- seq(.1, 0.9, by = 0.02)

ths <- thresholder(gbm_pima,
                   threshold = probs,
                   final = TRUE,
                   statistics = "all")

head(ths)

Sensitivity Specificity Pos Pred Value Neg Pred Value Precision Recall        F1 Prevalence Detection Rate Detection Prevalence
1     200                10      0.01              4           0.10       1.000  0.02222222      0.6562315      1.0000000 0.6562315  1.000 0.7924209  0.6510595      0.6510595            0.9922078
2     200                10      0.01              4           0.12       1.000  0.05213675      0.6633439      1.0000000 0.6633439  1.000 0.7975413  0.6510595      0.6510595            0.9817840
3     200                10      0.01              4           0.14       0.992  0.05954416      0.6633932      0.8666667 0.6633932  0.992 0.7949393  0.6510595      0.6458647            0.9739918
4     200                10      0.01              4           0.16       0.984  0.07435897      0.6654277      0.7936508 0.6654277  0.984 0.7936383  0.6510595      0.6406699            0.9636022
5     200                10      0.01              4           0.18       0.984  0.14188034      0.6821550      0.8750000 0.6821550  0.984 0.8053941  0.6510595      0.6406699            0.9401230
6     200                10      0.01              4           0.20       0.980  0.17179487      0.6886786      0.8833333 0.6886786  0.980 0.8086204  0.6510595      0.6380725            0.9271018
  Balanced Accuracy  Accuracy      Kappa          J      Dist
1         0.5111111 0.6588517 0.02833828 0.02222222 0.9777778
2         0.5260684 0.6692755 0.06586592 0.05213675 0.9478632
3         0.5257721 0.6666781 0.06435166 0.05154416 0.9406357
4         0.5291795 0.6666781 0.07134190 0.05835897 0.9260250
5         0.5629402 0.6901572 0.15350721 0.12588034 0.8585308
6         0.5758974 0.6979836 0.18460584 0.15179487 0.8288729

提取基于您偏好的度量标准的阈值概率。
ths %>%
  mutate(prob = probs) %>%
  filter(J == max(J)) %>%
  pull(prob) -> thresh_prob

thresh_prob
0.74

在测试数据上进行预测

pred <- predict(gbm_pima, newdata = ts, type = "prob")

根据测试集中的响应创建一个数值响应(0或1),因为这对来自ModelMetrics包的函数是必要的。

real <- as.numeric(factor(ts$diabetes))-1

ModelMetrics::sensitivity(real, pred$pos, cutoff = thresh_prob)
0.2238806 #based on this it is clear the threshold chosen is not optimal on this test data

ModelMetrics::specificity(real, pred$pos, cutoff = thresh_prob)
0.956

ModelMetrics::kappa(real, pred$pos, cutoff = thresh_prob)
0.2144026  #based on this it is clear the threshold chosen is not optimal on this test data

ModelMetrics::mcc(real, pred$pos, cutoff = thresh_prob)
0.2776309  #based on this it is clear the threshold chosen is not optimal on this test data

ModelMetrics::auc(real, pred$pos)
0.8047463  #decent AUC and low mcc and kappa indicate a poor choice of threshold

Auc是所有阈值的度量,因此不需要指定截止阈值。
由于只使用了一个训练/测试拆分,性能评估会存在偏差。最好使用嵌套重采样,以便可以在多个训练/测试拆分上进行评估。以下是一种执行嵌套重采样的方法。
编辑:回答评论中的问题。
要创建roc曲线,您不需要计算所有阈值上的灵敏度和特异性,您可以使用专门的软件包来完成此任务。结果可能更加可靠。
我更喜欢使用pROC软件包:
library(pROC)

roc.obj <- roc(real, pred$pos)
plot(roc.obj, print.thres = "best")

enter image description here

图中最佳阈值是在测试数据上具有最高特异性+灵敏度的阈值。很明显,这个阈值(0.289)与基于交叉验证预测得到的阈值(0.74)相比要低得多。这就是我说如果你调整交叉验证预测的阈值并使用因此获得的性能作为阈值成功的指标,将会存在相当乐观的偏差的原因。
在上面的例子中,不调整阈值会导致测试集上更好的性能。这可能对Pima印第安人数据集普遍适用,也可能是一个不幸的训练/测试分割情况。因此,最好使用嵌套重采样来验证这种情况。

谢谢您的帮助,missue!只是想澄清一下,如果AUC不需要截断阈值,那么针对测试数据集呈现的ROC曲线就不需要基于阈值进行更新了吗?我之所以问这个问题,是因为我在文献中读到过......其中ROC曲线是通过改变判别阈值并绘制TPR与FPR之间的曲线而创建的。当我这样做时,我得到的不是曲线,而是两条直线汇聚成一个点,这符合1/0类的预期。我想根据更新的阈值返回概率。我该怎么做? - SB21
1
我提供了一种使用R构建ROC曲线的方法,并附有一些额外的解释。 - missuse
谢谢你,missue,这个答案非常适合我所需! - SB21
很高兴听到这个消息。请阅读此链接:https://stackoverflow.com/help/someone-answers - missuse

网页内容由stack overflow 提供, 点击上面的
可以查看英文原文,
原文链接