马尔可夫链和R中的小数点?

5

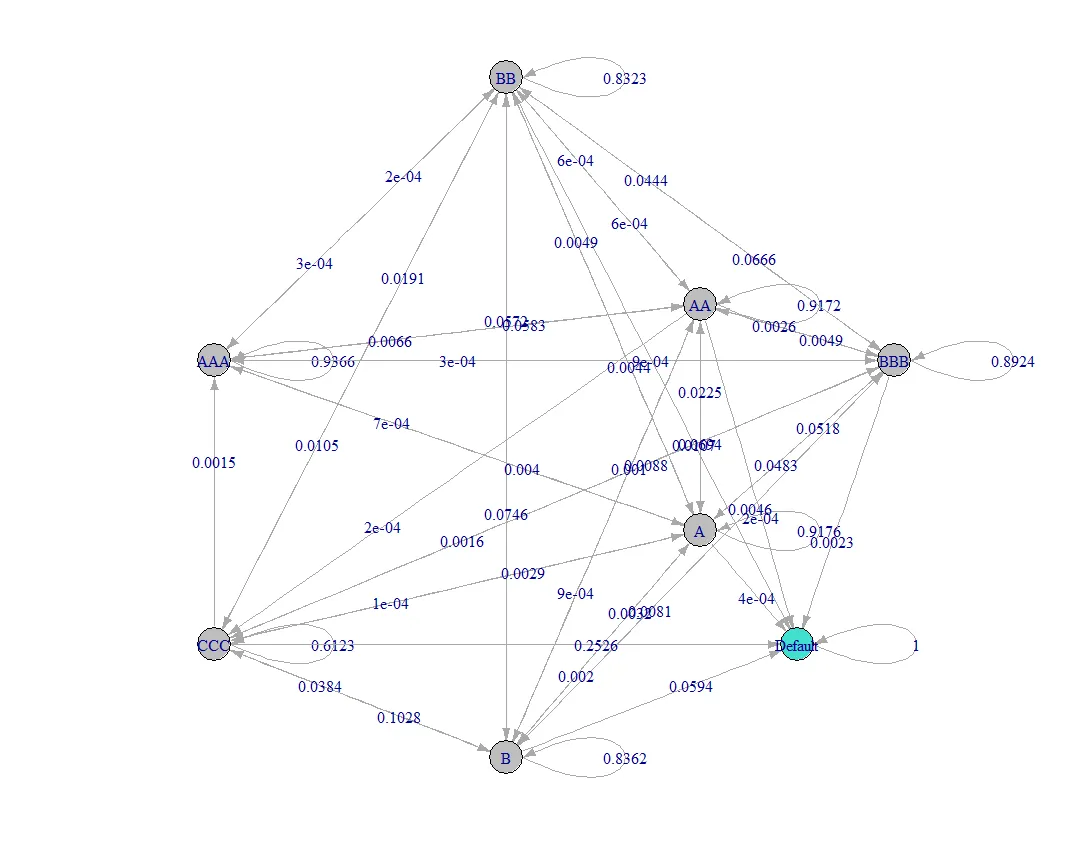
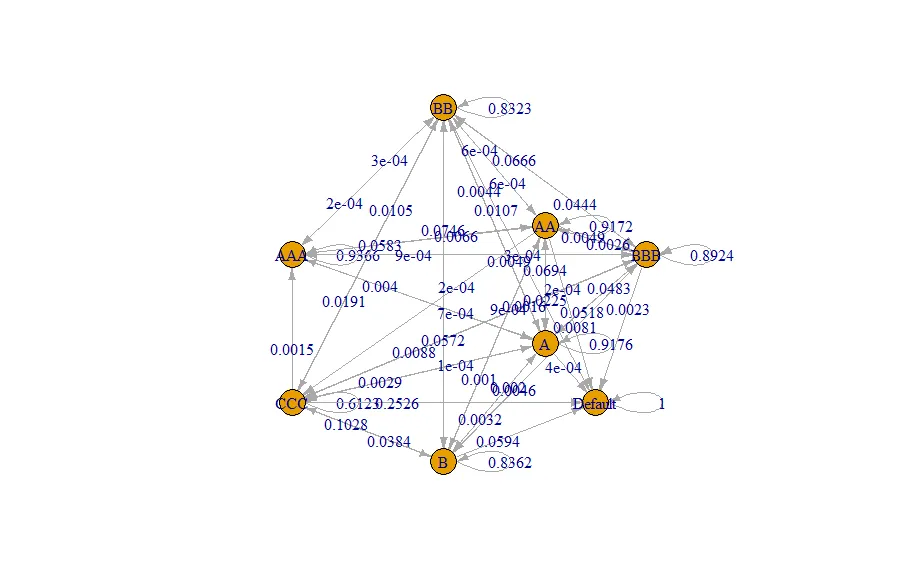
我已经在R中从矩阵绘制了一个马尔可夫链。然而,我有许多小于0.01的概率,因此我的概率图看起来像这样:

enter image description here

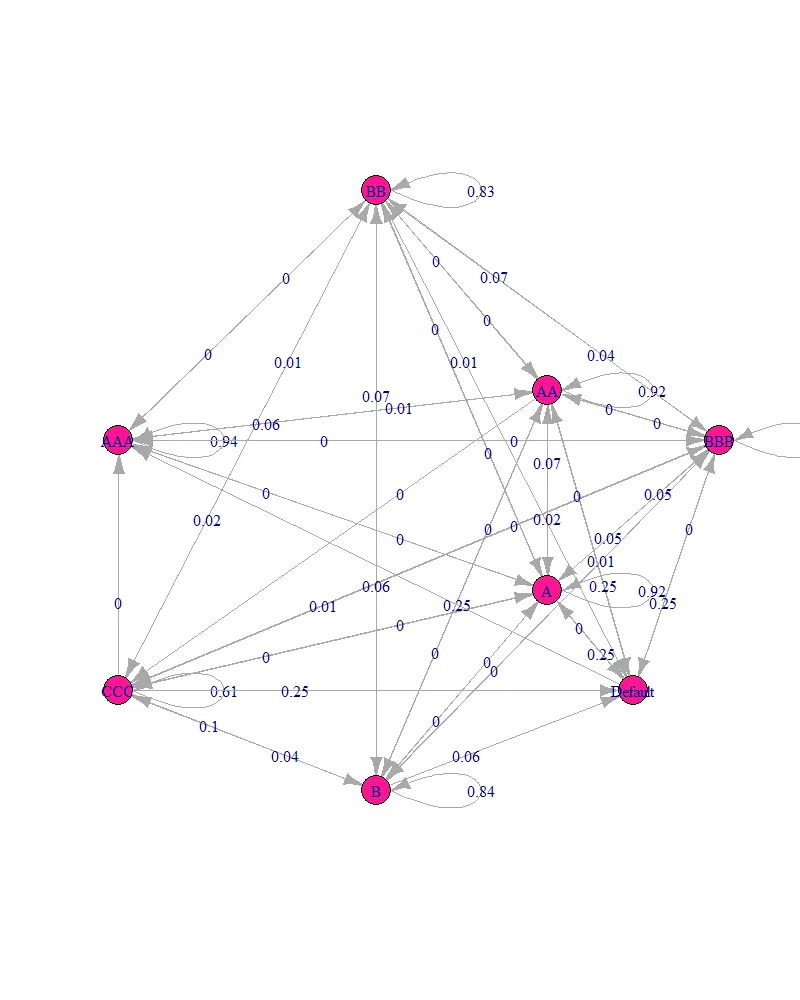
我已经搜索了几个小时,但似乎找不到一种方法可以显示所有4位小数。是否有任何格式化方法或者我应该保持原样?

我的代码如下:

library(markovchain)

newtransition.matrix <- matrix( data = c(
  .9366, .0066, .0007, .0003 ,.0003, 0, .0015, 0, 
  .0583, .9172, .0225, .0026, .0006, .001, 0, 0,
  .004, .0694, .9176, .0483, .0044, .0032, .0029, 0,
  .0009, .0049, .0518, .8924, .0666, .0046, .0088, 0,
  .0002, .0006, .0049, .0444, .8323, .0572, .0191, 0,
  0, .0009, .002, .0081, .0746, .8362, .1028, 0,
  0, .0002, .0001, .0016, .0105, .0384, .6123, 0,
  0, .0002, .0004, .0023, .0107, .0594, .2526, 1),
  nrow = 8, ncol = 8,
  dimnames = list( c( "AAA", "AA", "A", "BBB", "BB", "B", "CCC", "Default" ), c( "AAA", "AA", "A", "BBB", "BB", "B", "CCC", "Default") ) )
 print( newtransition.matrix )

newtransition.matrix <- new( "markovchain", transitionMatrix = newtransition.matrix )
layout <- matrix(c(-3, 1, 2, 2, 2, -2, 4, 1, 0, 6, 0, -6, -3, -4, 3, -4), ncol = 2, byrow = TRUE)

plot(newtransition.matrix, vertex.size = 10, layout = layout, edge.arrow.size=0.25)

许多感谢!

我查看了https://mran.revolutionanalytics.com/web/packages/markovchain/vignettes/an_introduction_to_markovchain_package.pdf的包文档,似乎只能显示最多2位小数。我不知道这是否可接受,但您可以将所有内容乘以100或类似的方法来解决吗? - Seymour
这可能是故意的,因为在小于两位小数时,该图会变得难以阅读。我认为您最好查看转移矩阵本身。 - Anonymous coward
@Seymour把所有东西乘以100(因此将概率显示为百分比)似乎是最好的解决方案。下面的解决方案(尽管它们令人印象深刻)过于混乱,难以阅读。 - John Coleman
@John Coleman 我同意解决方案中有太多小数位数,看起来很混乱。还有一些其他的软件包可能能够完成整理工作(请参见https://dev59.com/mXnZa4cB1Zd3GeqPnj2Q#21035960),但我个人喜欢使用百分比的想法。 - Marcus Campbell
2个回答

5

您需要编辑S4方法。绘图函数中硬编码了2位数限制。我无法仅通过代码编辑函数主体(如果有人能够解决,请留言)。下面的代码需要一些用户输入。

# Digging to find the plotting function for markovchain
showMethods(plot)

# Find the source code
f <- getMethod("plot", signature = c(x="markovchain", y="missing"))

# Ahh it uses plot.igraph, and the labels are being specified with edge.label = edgeLabel
# But edgeLabel is being rounded to 2 digits
# Extract and edit the body of f, 
# Change round(E(netMc)$weight/100, 2) to round(E(netMc)$weight/100, 4) or something larger
g <- edit(body(f@.Data))

# Store the edited body again
body(f@.Data) <- g

# Call new plotting function to plot with more digits
f(newtransition.matrix, vertex.size = 10, layout = layout, edge.arrow.size=0.25)

enter image description here


1
我非常喜欢这个答案,因为整体的思考过程——使用 showMethods()getMethod() 调查函数的行为——在许多情况下都非常有帮助,而不仅仅是在这种情况下。 - Marcus Campbell

5
这里有一个简单的解决方案,它使用了 igraph 包。如果您查看 markovchain 的文档,您会发现其绘图函数仅调用 igraph 中的绘图函数,因此您会发现许多(如果不是全部)绘制参数在两种对象之间是兼容的。
在这里,我们只需从转移矩阵中创建一个 igraph 对象,并绘制该对象。您可能会发现这比直接绘制 markovchain 对象更方便。
library(markovchain)
library(igraph)
newtransition.matrix <- new( "markovchain", transitionMatrix = newtransition.matrix )
layout <- matrix(c(-3, 1, 2, 2, 2, -2, 4, 1, 0, 6, 0, -6, -3, -4, 3, -4),
ncol = 2,
byrow = TRUE)

# create an igraph object from your transition matrix
graph <- as(newtransition.matrix, "igraph") 

plot(graph, vertex.size = 15,
            edge.label = E(graph)$prob, # We add the proper edge labels here
            layout = layout,
            edge.arrow.size=0.25)

enter image description here


网页内容由stack overflow 提供, 点击上面的
可以查看英文原文,
原文链接