我有以下这些数据结构:
X axis values:
delta_Array = np.array([1000,2000,3000, 4000, 5000, 6000, 7000, 8000, 9000, 10000])
Y Axis values
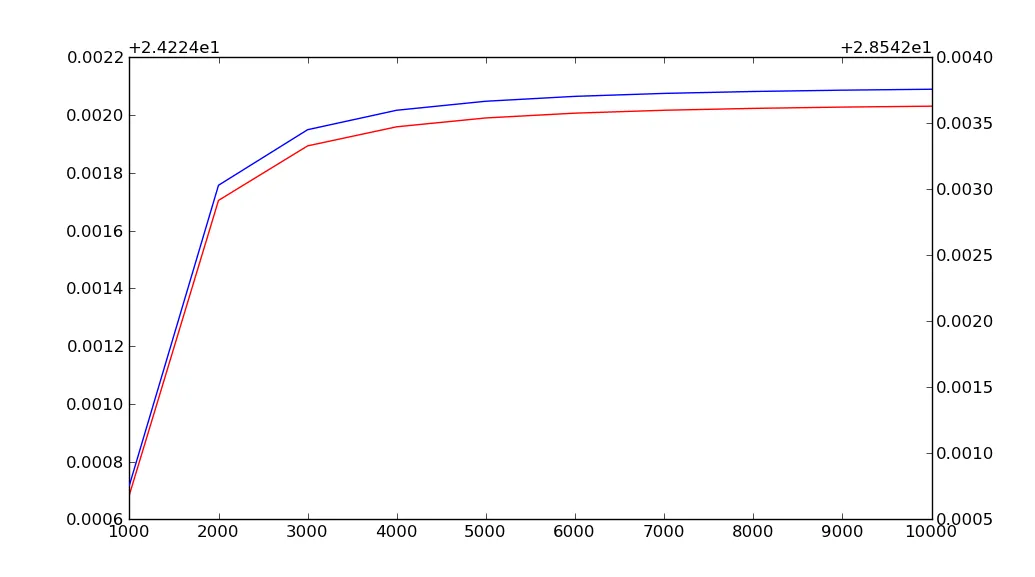
error_matrix =
[[ 24.22468454 24.22570421 24.22589308 24.22595919 24.22598979
24.22600641 24.22601644 24.22602294 24.2260274 24.22603059]
[ 28.54275713 28.54503017 28.54545119 28.54559855 28.54566676
28.54570381 28.54572615 28.54574065 28.5457506 28.54575771]]
我该如何使用matplotlib和Python将它们绘制为线图?
我想到的这段代码生成了一条平直的线,如下所示: figure(3) i = 0
 for i in range(error_matrix.shape[0]):
  plot(delta_Array, error_matrix[i,:])

 title('errors')
 xlabel('deltas')
 ylabel('errors')
 grid()
 show()
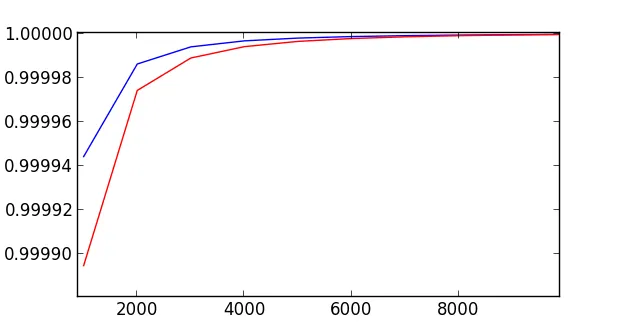
这里的问题似乎是轴的缩放。但是我不确定如何解决它。有什么想法或建议可以让曲率正确显示吗?