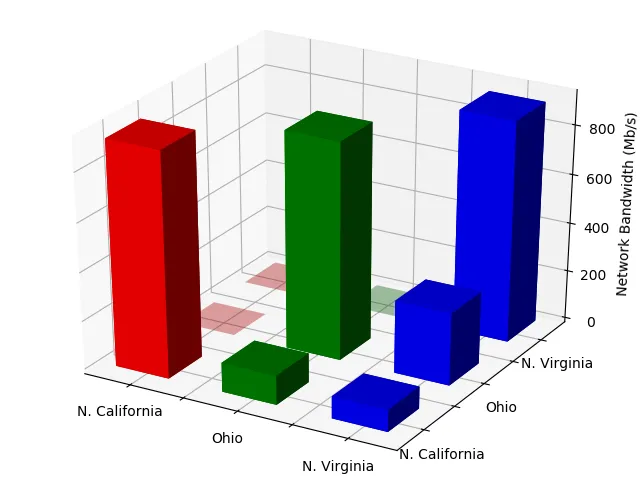
我有一个显示两个地区网络带宽的三维条形图。我想在matplotlib中将高度为0的条形设置为透明。但在我的输出中,它们会形成高度为0的正方形颜色块。
我该如何实现呢?
代码:
from mpl_toolkits.mplot3d import Axes3D
import matplotlib.pyplot as plt
import numpy as np
%matplotlib inline

data = np.array([
[1000,200],
[100,1000],
])

column_names = ['','Oregon','', 'Ohio','']
row_names = ['','Oregon','', 'Ohio']

fig = plt.figure()
ax = Axes3D(fig)

lx= len(data[0])            # Work out matrix dimensions
ly= len(data[:,0])

xpos = np.arange(0,lx,1)    # Set up a mesh of positions
ypos = np.arange(0,ly,1)
xpos, ypos = np.meshgrid(xpos+0.25, ypos+0.25)

xpos = xpos.flatten()   # Convert positions to 1D array
ypos = ypos.flatten()
zpos = np.zeros(lx*ly)

dx = 0.5 * np.ones_like(zpos)
dy = dx.copy()
dz = data.flatten()

cs = ['r', 'g'] * ly

ax.bar3d(xpos,ypos,zpos, dx, dy, dz, color=cs)

ax.w_xaxis.set_ticklabels(column_names)
ax.w_yaxis.set_ticklabels(row_names)
ax.set_zlabel('Mb/s')

plt.show()
plt.savefig()之前尝试使用plt.tight_layout()。 - gehbiszumeis