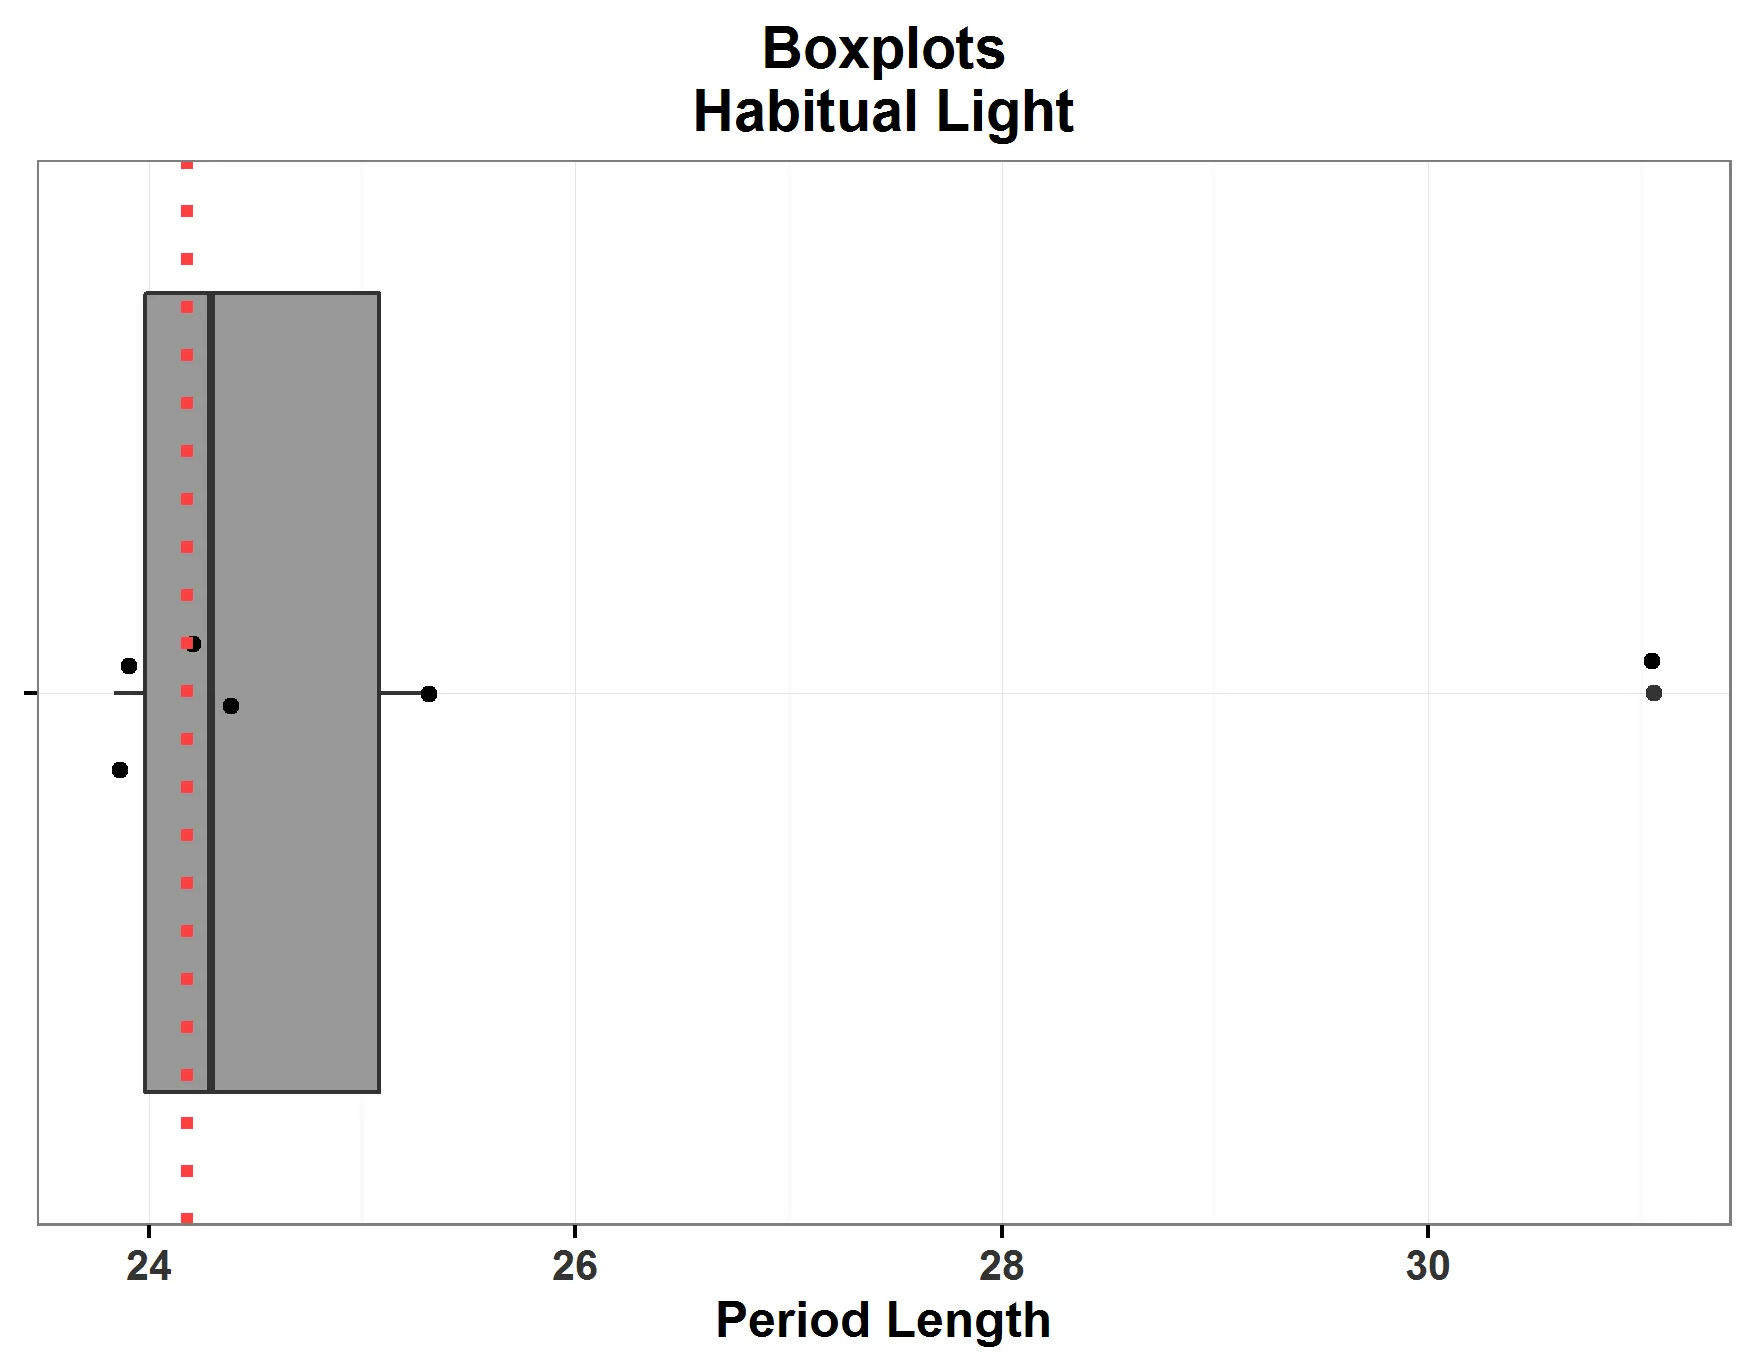
问:我正在使用ggplot的geom_boxplot绘制数据集。然而,当我尝试使用geom_jitter()绘制所有数据点时,我的数据中的离群值被复制了。其它所有数据点都正常。问题出在哪里?
示例代码:
PeakPeriod_24h <- c (31.05820, 23.83500, 24.36254, 25.31609, 24.21623, 23.90320)
condition <- rep("HL",6)
data_HL <- data.frame(condition, PeakPeriod_24h)
p <- ggplot(data_HL, aes(x=condition, y=PeakPeriod_24h, fill=condition))
p + geom_boxplot()+
  geom_jitter(width = 0.3)+
  theme_bw()+
  coord_flip()+
  geom_hline(aes(yintercept=24.18), colour="brown1", linetype="dotted", size = 1.4)+
  scale_y_continuous(limits=c(), name = "Period Length")+
  ggtitle("Boxplots\nHabitual Light")+
  scale_fill_manual(values = c("gray60"))+
  theme(plot.title = element_text(size=14, face="bold", vjust = .5),
    axis.title.y = element_blank(),
    axis.text.y = element_blank(),
    axis.title.x = element_text(size=12, face = "bold"),
    axis.text.x = element_text(size = 10, face = "bold", colour = "gray20"))+
  guides(fill=FALSE)
谢谢!