在Matplotlib中绘制tan函数的图像

4

我有以下代码:

from mpl_toolkits.axes_grid.axislines import SubplotZero
from matplotlib.transforms import BlendedGenericTransform
import matplotlib.pyplot as plt
import numpy

if 1:
    fig = plt.figure(1)
    ax = SubplotZero(fig, 111)
    fig.add_subplot(ax)

    ax.axhline(linewidth=1.7, color="black")
    ax.axvline(linewidth=1.7, color="black")

    plt.xticks([1])
    plt.yticks([])

    ax.text(0, 1.05, 'y', transform=BlendedGenericTransform(ax.transData, ax.transAxes), ha='center')
    ax.text(1.05, 0, 'x', transform=BlendedGenericTransform(ax.transAxes, ax.transData), va='center')

    for direction in ["xzero", "yzero"]:
        ax.axis[direction].set_axisline_style("-|>")
        ax.axis[direction].set_visible(True)

    for direction in ["left", "right", "bottom", "top"]:
        ax.axis[direction].set_visible(False)

    x = numpy.linspace(-1, 1, 10000)
    ax.plot(x, numpy.tan(2*(x - numpy.pi/2)), linewidth=1.2, color="black")

    plt.ylim(-5, 5)
    plt.savefig('graph.png')

这会产生这个图形: graph

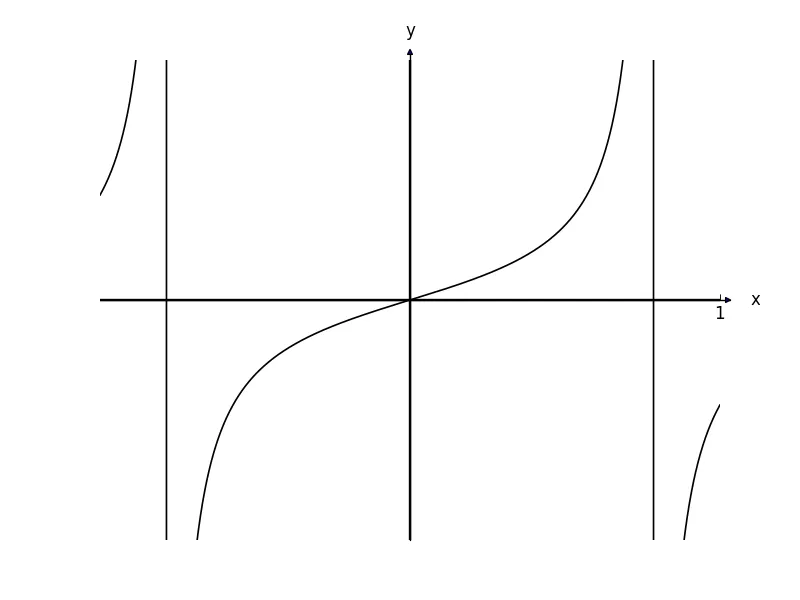
正如您所看到的,不仅绘制了tan图形,而且还添加了一部分线条以连接tan图形的渐近区域,在那里通常会有一个渐近线。

是否有一些内置的方法可以跳过该部分?或者我将绘制由渐近线界定的不相交的tan函数不同区域(如果你明白我的意思的话)?


仅为了澄清:您是否想要去掉连接-∞值的水平线? - jsalonen
@jsalonen 你是指垂直线吗?如果是的话,是的。 - nebffa
2个回答

6

以下是您可以尝试的方法:设置有限阈值,并修改您的函数以在那些点之后提供非有限值。实际代码修改:

yy = numpy.tan(2*(x - numpy.pi/2))
threshold = 10000
yy[yy>threshold] = numpy.inf
yy[yy<-threshold] = numpy.inf
ax.plot(x, yy, linewidth=1.2, color="black")

结果如下:

结果


由于某种原因,当我将你的解决方案添加到我的代码中时,我没有得到与你相同的输出。你是不是也想使用"<-"运算符而不是"<"运算符来执行"yy[yy<-threshold] = numpy.inf"操作?尽管你的解决方案非常简单,但我认为这是一个很好的主意。 - nebffa
运算符是 ><。你使用的库版本是什么?我正在 Python 2.7.4 上运行 numpy 1.7.1 和 matplotlib 1.2.1。另外,您可以尝试降低阈值以测试是否按预期工作。 - jsalonen
不,我的意思是看看你的第四行;你使用了“<-”。 - nebffa
哈哈,我真傻...显然你是在做"< -threshold",我还以为numpy在Python语言中添加了一个新的运算符。顺便说一下,降低阈值已经完美地解决了问题。感谢你的帮助。 - nebffa
1
就是这样!我使用了两个运算符:<-- 运算符具有更高的优先级,因此在 < 之前进行评估。有关详细信息,请参见:http://docs.python.org/2/reference/expressions.html#operator-precedence - jsalonen

0

在此输入图像描述这段代码创建了一个图形和一个正切函数的子图。当cos(x)趋近于0时,会插入NaN(意思是“不是数字”),而NaN不会被绘制或连接。 matplot-fmt-pi由k-donn(https://pypi.org/project/matplot-fmt-pi/)创建,用于更改格式化程序,使x标签和刻度对应于分数格式的π/8的倍数。 绘图格式(网格、图例、限制、轴)按照注释进行。

import matplotlib.pyplot as plt
import numpy as np
from matplot_fmt_pi import MultiplePi

fig, ax = plt.subplots()        # creates a figure and one subplot
x = np.linspace(-2 * np.pi, 2 * np.pi, 1000)
y = np.tan(x)
y[np.abs(np.cos(x)) <= np.abs(np.sin(x[1]-x[0]))] = np.nan
# This operation inserts a NaN where cos(x) is reaching 0
# NaN means "Not a Number" and NaNs are not plotted or connected
ax.plot(x, y, lw=2, color="blue", label='Tangent')
# Set up grid, legend, and limits
ax.grid(True)
ax.axhline(0, color='black', lw=.75)
ax.axvline(0, color='black', lw=.75)
ax.set_title("Trigonometric Functions")
ax.legend(frameon=False)    # remove frame legend frame
# axis formatting
ax.set_xlim(-2 * np.pi, 2 * np.pi)
pi_manager = MultiplePi(8)          # number= ticks between 0 - pi
ax.xaxis.set_major_locator(pi_manager.locator())
ax.xaxis.set_major_formatter(pi_manager.formatter())
plt.ylim(top=10)  # y axis limit values
plt.ylim(bottom=-10)
y_ticks = np.arange(-10, 10, 1)
plt.yticks(y_ticks)
fig
[![enter image description here][1]][1]plt.show()

网页内容由stack overflow 提供, 点击上面的
可以查看英文原文,
原文链接