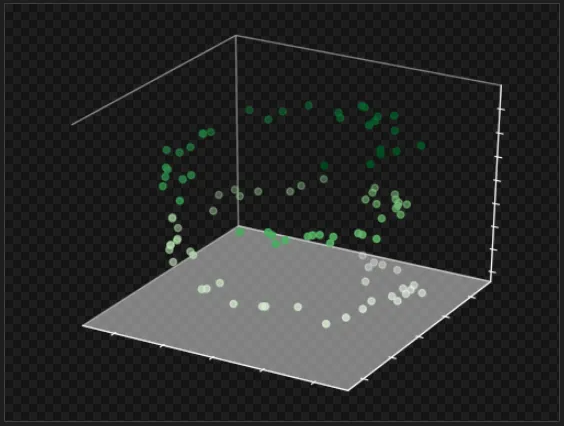
您可以生成一个矩形网格,并使用
mpl_toolkits.mplot3d.art3d中的
pathpatch_2d_to_3d函数将其插入到3D场景中:
import numpy as np
import matplotlib.pyplot as plt
from mpl_toolkits.mplot3d import Axes3D
from matplotlib.patches import Rectangle
import mpl_toolkits.mplot3d.art3d as art3d
plt.style.use('dark_background')
fig = plt.figure(frameon=False)
ax = fig.add_subplot(111, projection='3d')
ax.xaxis.pane.fill = False
ax.yaxis.pane.fill = False
ax.grid(False)
ax.set_xticklabels([])
ax.set_yticklabels([])
ax.set_zticklabels([])
for x_index, x in enumerate(np.arange(-1, 1.1, 0.2)):
for y_index, y in enumerate(np.arange(-1, 1.1, 0.2)):
if (x_index+y_index)%2:
p = Rectangle([x,y], 0.2, 0.2)
ax.add_patch(p)
art3d.pathpatch_2d_to_3d(p, z=0, zdir="z")
ax.set(xlim=(-1,1.1), ylim=(-1,1.2), zlim=(0,15))
zdata = 15 * np.random.random(100)
xdata = np.sin(zdata) + 0.1 * np.random.randn(100)
ydata = np.cos(zdata) + 0.1 * np.random.randn(100)
ax.scatter3D(xdata, ydata, zdata, c=zdata, cmap='Greens')
file_path = 'charts/3d.png'
fig.savefig(file_path, bbox_inches='tight', pad_inches=0.05, transparent=True)
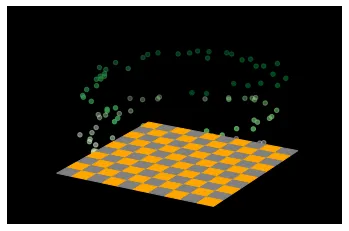
编辑:更清晰的版本
RECT_SIZE_X = 0.2
RECT_SIZE_Y = 0.2
xlims = (-1, 1)
ylims = (-1, 1)
for x_index, x_pos in enumerate(np.arange(xlims[0], xlims[1], RECT_SIZE_X)):
for y_index, y_pos in enumerate(np.arange(ylims[0], ylims[1], RECT_SIZE_Y)):
if (x_index+y_index)%2:
p = Rectangle([x_pos, y_pos], RECT_SIZE_X, RECT_SIZE_Y, color='orange')
else:
p = Rectangle([x_pos, y_pos], RECT_SIZE_X, RECT_SIZE_Y, color='gray')
ax.add_patch(p)
art3d.pathpatch_2d_to_3d(p, z=0, zdir="z")
ax.set(xlim=xlims, ylim=ylims, zlim=(0,15))
ax.w_xaxis.line.set_color((1.0, 1.0, 1.0, 0.0))
ax.w_yaxis.line.set_color((1.0, 1.0, 1.0, 0.0))
ax.w_zaxis.line.set_color((1.0, 1.0, 1.0, 0.0))
ax.w_xaxis.set_pane_color((1.0, 1.0, 1.0, 0.0))
ax.w_yaxis.set_pane_color((1.0, 1.0, 1.0, 0.0))
ax.w_zaxis.set_pane_color((1.0, 1.0, 1.0, 0.0))
ax.set_xticks([])
ax.set_yticks([])
ax.set_zticks([])