为了使它更具动态性,您可以将
**kwargs传递给
create_dendogram()函数。如果您检查源代码,需要在
_Dendogram类和
get_dendrogram_traces()函数中的多个其他位置传递
**kwargs。
如果您不想混乱
_dendogram.py位于默认目录中,我建议您复制整个文件并在当前目录中创建一个新文件(假设为
modified_dendogram.py)。
然后,只需使用
from modified_dendogram import create_dendrogram导入该本地文件即可。
现在,您可以使用
scipy.cluster.hierarchy.dendrogram支持的所有参数。
modified_dendogram.py:
from __future__ import absolute_import
from collections import OrderedDict
from plotly import exceptions, optional_imports
from plotly.graph_objs import graph_objs
np = optional_imports.get_module("numpy")
scp = optional_imports.get_module("scipy")
sch = optional_imports.get_module("scipy.cluster.hierarchy")
scs = optional_imports.get_module("scipy.spatial")
def create_dendrogram(
X,
orientation="bottom",
labels=None,
colorscale=None,
distfun=None,
linkagefun=lambda x: sch.linkage(x, "complete"),
hovertext=None,
color_threshold=None,
**kwargs
):
"""
Function that returns a dendrogram Plotly figure object. This is a thin
wrapper around scipy.cluster.hierarchy.dendrogram.
See also https://dash.plot.ly/dash-bio/clustergram.
:param (ndarray) X: Matrix of observations as array of arrays
:param (str) orientation: 'top', 'right', 'bottom', or 'left'
:param (list) labels: List of axis category labels(observation labels)
:param (list) colorscale: Optional colorscale for the dendrogram tree.
Requires 8 colors to be specified, the 7th of
which is ignored. With scipy>=1.5.0, the 2nd, 3rd
and 6th are used twice as often as the others.
Given a shorter list, the missing values are
replaced with defaults and with a longer list the
extra values are ignored.
:param (function) distfun: Function to compute the pairwise distance from
the observations
:param (function) linkagefun: Function to compute the linkage matrix from
the pairwise distances
:param (list[list]) hovertext: List of hovertext for constituent traces of dendrogram
clusters
:param (double) color_threshold: Value at which the separation of clusters will be made
Example 1: Simple bottom oriented dendrogram
>>> from plotly.figure_factory import create_dendrogram
>>> import numpy as np
>>> X = np.random.rand(10,10)
>>> fig = create_dendrogram(X)
>>> fig.show()
Example 2: Dendrogram to put on the left of the heatmap
>>> from plotly.figure_factory import create_dendrogram
>>> import numpy as np
>>> X = np.random.rand(5,5)
>>> names = ['Jack', 'Oxana', 'John', 'Chelsea', 'Mark']
>>> dendro = create_dendrogram(X, orientation='right', labels=names)
>>> dendro.update_layout({'width':700, 'height':500}) # doctest: +SKIP
>>> dendro.show()
Example 3: Dendrogram with Pandas
>>> from plotly.figure_factory import create_dendrogram
>>> import numpy as np
>>> import pandas as pd
>>> Index= ['A','B','C','D','E','F','G','H','I','J']
>>> df = pd.DataFrame(abs(np.random.randn(10, 10)), index=Index)
>>> fig = create_dendrogram(df, labels=Index)
>>> fig.show()
"""
if not scp or not scs or not sch:
raise ImportError(
"FigureFactory.create_dendrogram requires scipy, \
scipy.spatial and scipy.hierarchy"
)
s = X.shape
if len(s) != 2:
exceptions.PlotlyError("X should be 2-dimensional array.")
if distfun is None:
distfun = scs.distance.pdist
dendrogram = _Dendrogram(
X,
orientation,
labels,
colorscale,
distfun=distfun,
linkagefun=linkagefun,
hovertext=hovertext,
color_threshold=color_threshold,
kwargs=kwargs
)
return graph_objs.Figure(data=dendrogram.data, layout=dendrogram.layout)
class _Dendrogram(object):
"""Refer to FigureFactory.create_dendrogram() for docstring."""
def __init__(
self,
X,
orientation="bottom",
labels=None,
colorscale=None,
width=np.inf,
height=np.inf,
xaxis="xaxis",
yaxis="yaxis",
distfun=None,
linkagefun=lambda x: sch.linkage(x, "complete"),
hovertext=None,
color_threshold=None,
kwargs=None
):
self.orientation = orientation
self.labels = labels
self.xaxis = xaxis
self.yaxis = yaxis
self.data = []
self.leaves = []
self.sign = {self.xaxis: 1, self.yaxis: 1}
self.layout = {self.xaxis: {}, self.yaxis: {}}
if self.orientation in ["left", "bottom"]:
self.sign[self.xaxis] = 1
else:
self.sign[self.xaxis] = -1
if self.orientation in ["right", "bottom"]:
self.sign[self.yaxis] = 1
else:
self.sign[self.yaxis] = -1
if distfun is None:
distfun = scs.distance.pdist
(dd_traces, xvals, yvals, ordered_labels, leaves) = self.get_dendrogram_traces(
X, colorscale, distfun, linkagefun, hovertext, color_threshold, kwargs
)
self.labels = ordered_labels
self.leaves = leaves
yvals_flat = yvals.flatten()
xvals_flat = xvals.flatten()
self.zero_vals = []
for i in range(len(yvals_flat)):
if yvals_flat[i] == 0.0 and xvals_flat[i] not in self.zero_vals:
self.zero_vals.append(xvals_flat[i])
if len(self.zero_vals) > len(yvals) + 1:
l_border = int(min(self.zero_vals))
r_border = int(max(self.zero_vals))
correct_leaves_pos = range(
l_border, r_border + 1, int((r_border - l_border) / len(yvals))
)
self.zero_vals = [v for v in correct_leaves_pos]
self.zero_vals.sort()
self.layout = self.set_figure_layout(width, height)
self.data = dd_traces
def get_color_dict(self, colorscale):
"""
Returns colorscale used for dendrogram tree clusters.
:param (list) colorscale: Colors to use for the plot in rgb format.
:rtype (dict): A dict of default colors mapped to the user colorscale.
"""
d = {
"r": "red",
"g": "green",
"b": "blue",
"c": "cyan",
"m": "magenta",
"y": "yellow",
"k": "black",
"w": "white",
}
default_colors = OrderedDict(sorted(d.items(), key=lambda t: t[0]))
if colorscale is None:
rgb_colorscale = [
"rgb(0,116,217)",
"rgb(35,205,205)",
"rgb(61,153,112)",
"rgb(40,35,35)",
"rgb(133,20,75)",
"rgb(255,65,54)",
"rgb(255,255,255)",
"rgb(255,220,0)",
]
else:
rgb_colorscale = colorscale
for i in range(len(default_colors.keys())):
k = list(default_colors.keys())[i]
if i < len(rgb_colorscale):
default_colors[k] = rgb_colorscale[i]
new_old_color_map = [
("C0", "b"),
("C1", "g"),
("C2", "r"),
("C3", "c"),
("C4", "m"),
("C5", "y"),
("C6", "k"),
("C7", "g"),
("C8", "r"),
("C9", "c"),
]
for nc, oc in new_old_color_map:
try:
default_colors[nc] = default_colors[oc]
except KeyError:
default_colors[nc] = "rgb(0,116,217)"
return default_colors
def set_axis_layout(self, axis_key):
"""
Sets and returns default axis object for dendrogram figure.
:param (str) axis_key: E.g., 'xaxis', 'xaxis1', 'yaxis', yaxis1', etc.
:rtype (dict): An axis_key dictionary with set parameters.
"""
axis_defaults = {
"type": "linear",
"ticks": "outside",
"mirror": "allticks",
"rangemode": "tozero",
"showticklabels": True,
"zeroline": False,
"showgrid": False,
"showline": True,
}
if len(self.labels) != 0:
axis_key_labels = self.xaxis
if self.orientation in ["left", "right"]:
axis_key_labels = self.yaxis
if axis_key_labels not in self.layout:
self.layout[axis_key_labels] = {}
self.layout[axis_key_labels]["tickvals"] = [
zv * self.sign[axis_key] for zv in self.zero_vals
]
self.layout[axis_key_labels]["ticktext"] = self.labels
self.layout[axis_key_labels]["tickmode"] = "array"
self.layout[axis_key].update(axis_defaults)
return self.layout[axis_key]
def set_figure_layout(self, width, height):
"""
Sets and returns default layout object for dendrogram figure.
"""
self.layout.update(
{
"showlegend": False,
"autosize": False,
"hovermode": "closest",
"width": width,
"height": height,
}
)
self.set_axis_layout(self.xaxis)
self.set_axis_layout(self.yaxis)
return self.layout
def get_dendrogram_traces(
self, X, colorscale, distfun, linkagefun, hovertext, color_threshold, kwargs={}
):
"""
Calculates all the elements needed for plotting a dendrogram.
:param (ndarray) X: Matrix of observations as array of arrays
:param (list) colorscale: Color scale for dendrogram tree clusters
:param (function) distfun: Function to compute the pairwise distance
from the observations
:param (function) linkagefun: Function to compute the linkage matrix
from the pairwise distances
:param (list) hovertext: List of hovertext for constituent traces of dendrogram
:rtype (tuple): Contains all the traces in the following order:
(a) trace_list: List of Plotly trace objects for dendrogram tree
(b) icoord: All X points of the dendrogram tree as array of arrays
with length 4
(c) dcoord: All Y points of the dendrogram tree as array of arrays
with length 4
(d) ordered_labels: leaf labels in the order they are going to
appear on the plot
(e) P['leaves']: left-to-right traversal of the leaves
"""
d = distfun(X)
Z = linkagefun(d)
P = sch.dendrogram(
Z,
orientation=self.orientation,
labels=self.labels,
no_plot=True,
color_threshold=color_threshold,
**kwargs
)
icoord = scp.array(P["icoord"])
dcoord = scp.array(P["dcoord"])
ordered_labels = scp.array(P["ivl"])
color_list = scp.array(P["color_list"])
colors = self.get_color_dict(colorscale)
trace_list = []
for i in range(len(icoord)):
if self.orientation in ["top", "bottom"]:
xs = icoord[i]
else:
xs = dcoord[i]
if self.orientation in ["top", "bottom"]:
ys = dcoord[i]
else:
ys = icoord[i]
color_key = color_list[i]
hovertext_label = None
if hovertext:
hovertext_label = hovertext[i]
trace = dict(
type="scatter",
x=np.multiply(self.sign[self.xaxis], xs),
y=np.multiply(self.sign[self.yaxis], ys),
mode="lines",
marker=dict(color=colors[color_key]),
text=hovertext_label,
hoverinfo="text",
)
try:
x_index = int(self.xaxis[-1])
except ValueError:
x_index = ""
try:
y_index = int(self.yaxis[-1])
except ValueError:
y_index = ""
trace["xaxis"] = "x" + x_index
trace["yaxis"] = "y" + y_index
trace_list.append(trace)
return trace_list, icoord, dcoord, ordered_labels, P["leaves"]
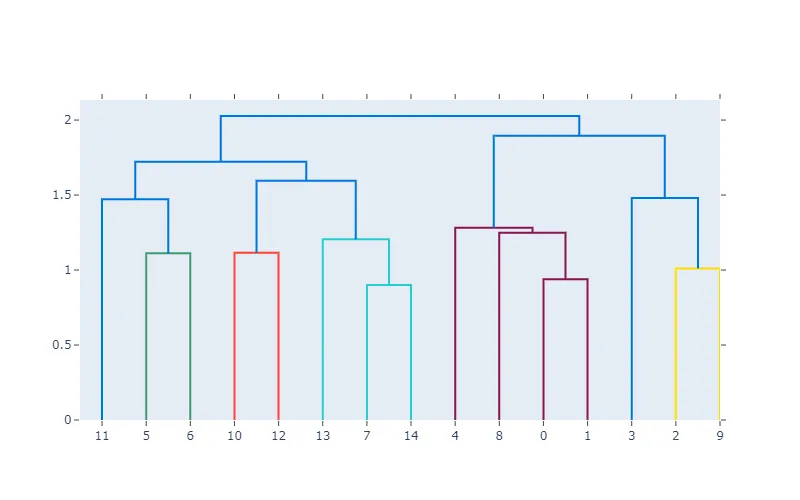
例子:
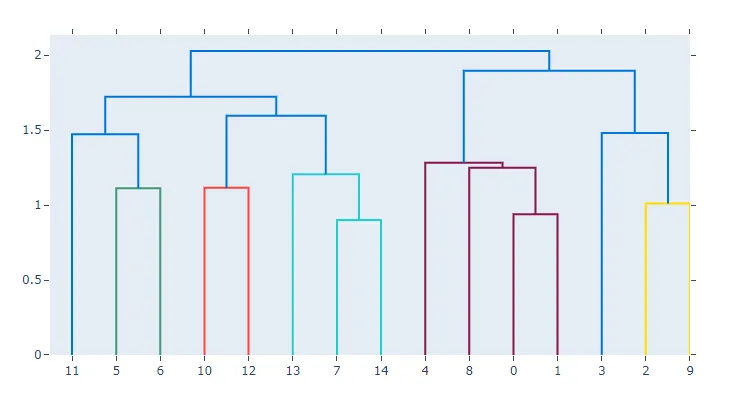
from modified_dendogram import create_dendrogram
import numpy as np
np.random.seed(1)
X = np.random.rand(15, 12)
fig = create_dendrogram(X)
fig.update_layout(width=800, height=500)
fig.show()
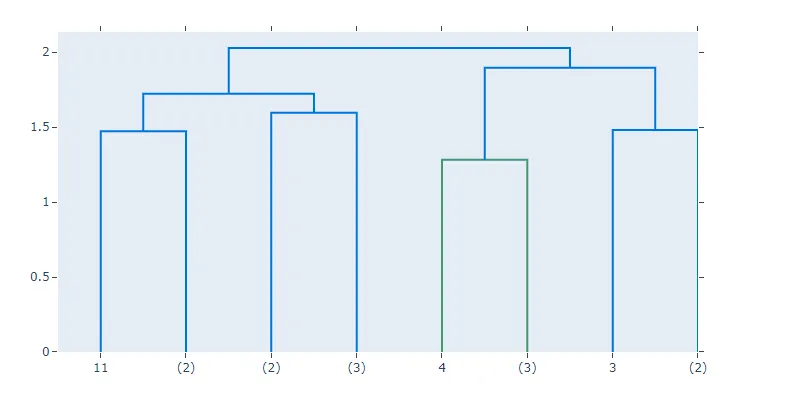
from utils.modified_dendogram import create_dendrogram
import numpy as np
np.random.seed(1)
X = np.random.rand(15, 12)
fig = create_dendrogram(X, truncate_mode="level", p=1)
fig.update_layout(width=800, height=500)
fig.show()