看起来plotly仪表图与subplot不兼容,因为最终两个仪表图会重叠在一起。
library(plotly)
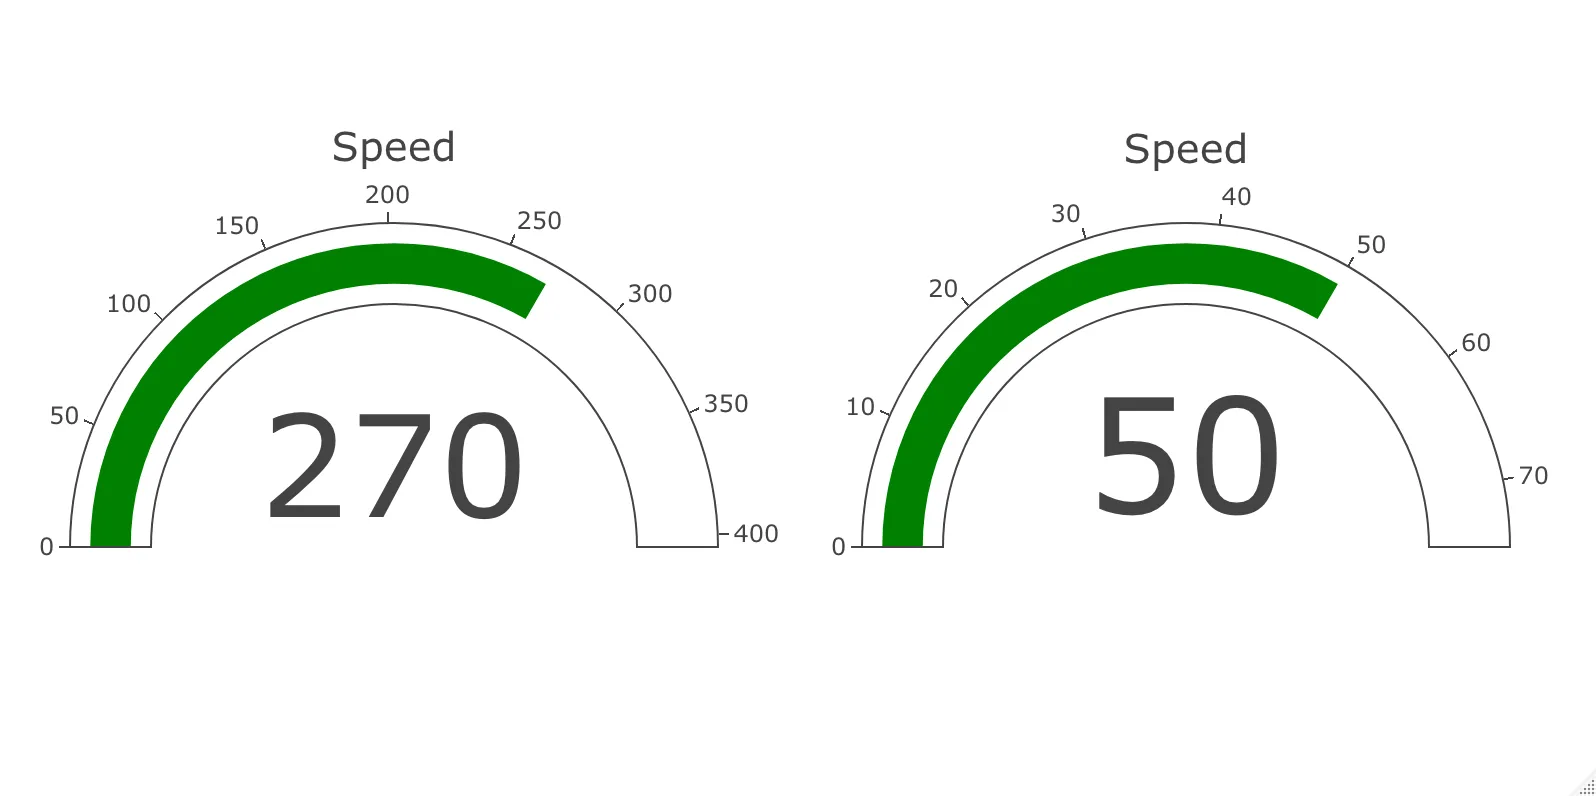
fig1 <- plot_ly(
domain = list(x = c(0, 1), y = c(0, 1)),
value = 270,
title = list(text = "Speed"),
type = "indicator",
mode = "gauge+number")
fig1 <- fig1 %>%
layout(margin = list(l=20,r=30))
fig1
fig2 <- plot_ly(
domain = list(x = c(0, 1), y = c(0, 1)),
value = 50,
title = list(text = "Speed"),
type = "indicator",
mode = "gauge+number")
fig2 <- fig2 %>%
layout(margin = list(l=20,r=30))
fig2
fig <- subplot(fig1,fig2)
fig