如何使用Python在一起绘制Plotly仪表图?

4

我在脚本中有两个仪表图,想要并排将它们可视化。

import plotly.graph_objects as go

fig1 = go.Figure(go.Indicator(mode="gauge+number",    value=400,    domain={'x': [0, 1], 'y': [0, 1]},    title={'text': "Speed 1"}))

fig2 = go.Figure(go.Indicator(mode="gauge+number",    value=250,    domain={'x': [0, 1], 'y': [0, 1]},    title={'text': "Speed 2"}))

如何将 fig1fig2 并排显示?


2
您收到了两条相似但各自有价值且可行的建议。如果您自己觉得有用,请考虑给予好评。同时,也请考虑将最符合您需求的那个答案标记为被采纳的答案。 - vestland
2个回答

5

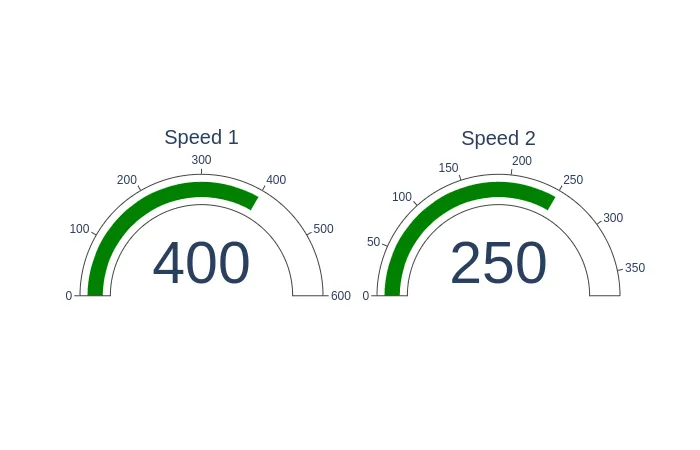
您可以使用子图将两个图形并排显示。

import plotly.graph_objs as go
from plotly.subplots import make_subplots

trace1 = go.Indicator(mode="gauge+number",    value=400,    domain={'row' : 1, 'column' : 1}, title={'text': "Speed 1"})
trace2 = go.Indicator(mode="gauge+number",    value=250,    domain={'row' : 1, 'column' : 2}, title={'text': "Speed 2"})

fig = make_subplots(
    rows=1,
    cols=2,
    specs=[[{'type' : 'indicator'}, {'type' : 'indicator'}]],
    )

fig.append_trace(trace1, row=1, col=1)
fig.append_trace(trace2, row=1, col=2)

fig.show()

enter image description here


4

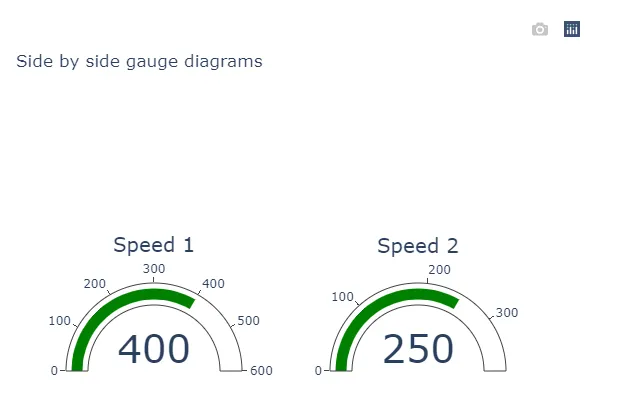
使用domain属性是正确的,但是您的具体规格有误。在下面的完整代码中,使用以下规格可以生成相关绘图:

域规格

 domain={'x': [0.0, 0.4], 'y': [0.0, 1]}

 domain={'x': [0.6, 1.0], 'y': [0., 1.00]}

情节

输入图像描述

完整代码

import plotly
import plotly.offline as py
import plotly.graph_objs as go
import plotly.express as px

# traces with separate domains to form a subplot
trace1 = go.Indicator(mode="gauge+number",    value=400,    domain={'x': [0.0, 0.4], 'y': [0.0, 1]},    title={'text': "Speed 1"})

trace2 = go.Indicator(mode="gauge+number",    value=250,    domain={'x': [0.6, 1.0], 'y': [0., 1.00]},    title={'text': "Speed 2"})

# layout and figure production
layout = go.Layout(height = 600,
                   width = 600,
                   autosize = False,
                   title = 'Side by side gauge diagrams')
fig = go.Figure(data = [trace1, trace2], layout = layout)
fig.show()

非常感谢 - 谢谢。是否可以做一个并排的仪表图,其中trace1和trace2不是完整的go.Indicator()代码,而是从创建仪表图表并返回每个使用该函数创建的仪表图指示器的fig.show()中调用trace1和trace2的函数?换句话说,我可以调用使用go.Indicator()创建仪表图表的函数来创建仪表图表,而不是像上面那样在trace1和trace2中创建仪表图表吗?我尝试过了,但无法使其工作。也许函数返回了错误的东西(fig.show())?谢谢! - BGG16
@GbG 感谢您的反馈。我不确定您所问的是否确实可行。如果是,如果您抽出时间写成新问题,我相信您会得到寻求帮助的协助。如果您这样做,我会确保仔细研究它。 - vestland
感谢@vestland。非常感激。 - BGG16

网页内容由stack overflow 提供, 点击上面的
可以查看英文原文,
原文链接