Plotly:并排的条形图和饼图

4
我希望使用R语言中的
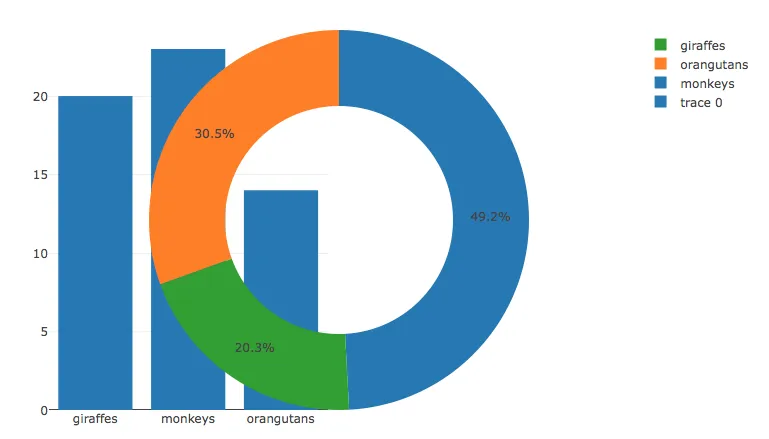
plotly包的subplot函数,将柱形图和饼图并排绘制。但是,一个大的饼图会在图表中心重叠显示柱形图。
以下是示例代码:
Animals <- c("giraffes", "orangutans", "monkeys")
SF_Zoo <- c(20, 14, 23)
LA_Zoo <- c(12, 18, 29)
data <- data.frame(Animals, SF_Zoo, LA_Zoo)

bar <- plot_ly(data, x = ~Animals, y = ~SF_Zoo, type = 'bar') %>%
  layout(yaxis = list(title = 'Count'), barmode = 'stack')

pie <- plot_ly(data, labels = ~Animals, values = ~LA_Zoo, type = 'pie', hole = 0.6)

subplot(bar, pie)

在此输入图片描述

如何解决这个问题?

1个回答

2

让我们试一下 -

library(plotly)

#sample data
Animals <- c("giraffes", "orangutans", "monkeys")
SF_Zoo <- c(20, 14, 23)
LA_Zoo <- c(12, 18, 29)
data <- data.frame(Animals, SF_Zoo, LA_Zoo)

#plot
plot_ly(data, x = ~Animals, y = ~SF_Zoo, type = 'bar') %>%
  layout(yaxis = list(title = 'Count'), xaxis = list(domain = c(0, 0.5)), barmode = 'stack') %>%
  add_trace(data, labels = ~Animals, values = ~LA_Zoo, type = 'pie', hole = 0.6,
            domain = list(x = c(0.5, 1)))

网页内容由stack overflow 提供, 点击上面的
可以查看英文原文,
原文链接