如何更改饼图(plotly)中标签的顺序?
我想要强制使用以下顺序:
我的csv文件:
给出这个图表: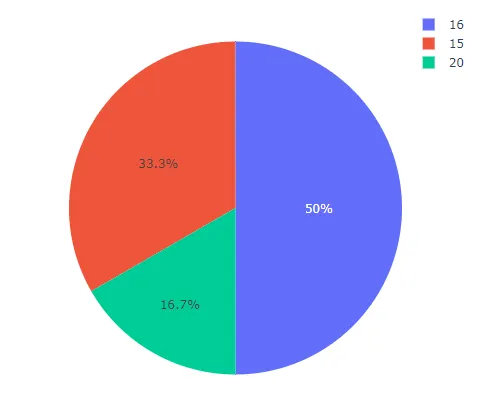
我想要强制使用以下顺序:
20 16 15,而不是16 15 20
我的csv文件:
id,A,B,C
1,15,16,45
2,20,15,54
3,16,18,60
4,16,15,54
5,15,12,68
6,16,20,68
我的Python代码
import pandas
import plotly.graph_objects as go

col_label = "A"
col_values = "Count"

data = pandas.read_csv(mycsvfile)
v = data[col_label].value_counts()
new = pandas.DataFrame({
    col_label: v.index,
    col_values: v.values
})
fig = go.Figure(
    data=[go.Pie(
        labels=new[col_label],
        values=new[col_values])
    ])
fig.show()
给出这个图表: