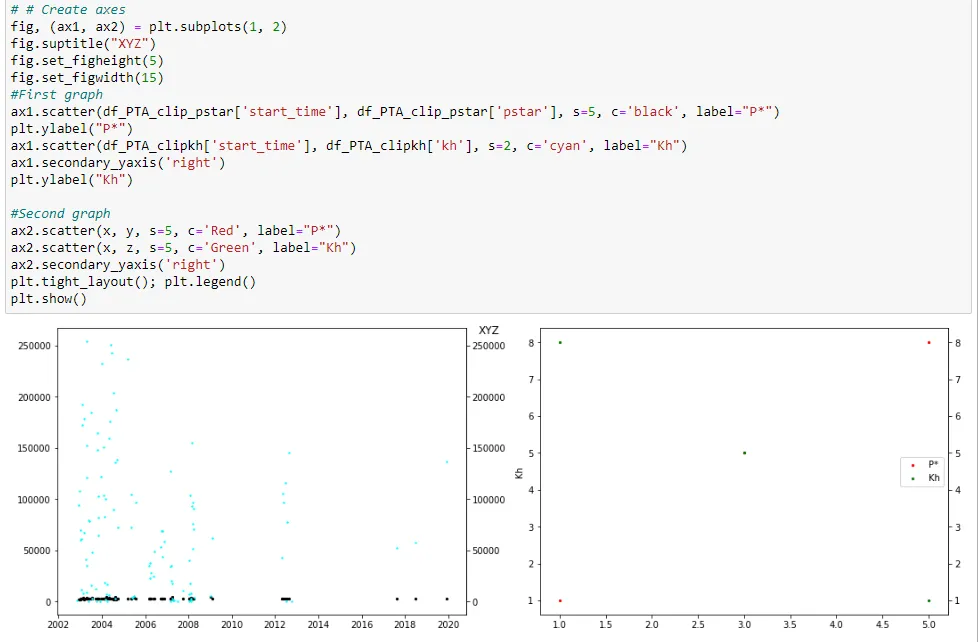
嗨,我正在尝试创建:
- 水平堆叠的图表
- 两个图表都有辅助轴
- 在不同的轴上具有不同的刻度 - 不幸的是,目前每个子图中我的 Y 轴都具有相同的刻度... :(
当前代码:
#  Create axes
fig, (ax1, ax2) = plt.subplots(1, 2)
fig.suptitle("XYZ")
fig.set_figheight(5)
fig.set_figwidth(15)
# First graph
ax1.scatter(
    df_PTA_clip_pstar["start_time"],
    df_PTA_clip_pstar["pstar"],
    s=5,
    c="black",
    label="P*",
)
plt.ylabel("P*")
ax1.scatter(df_PTA_clipkh["start_time"], df_PTA_clipkh["kh"], s=2, c="cyan", label="Kh")
ax1.secondary_yaxis("right")
plt.ylabel("Kh")

# Second graph - will add the correct data to this once first graph fixed
ax2.scatter(x, y, s=5, c="Red", label="P*")
ax2.scatter(x, z, s=5, c="Green", label="Kh")

ax2.secondary_yaxis("right")
plt.tight_layout()
plt.legend()
plt.show()
当前进展:
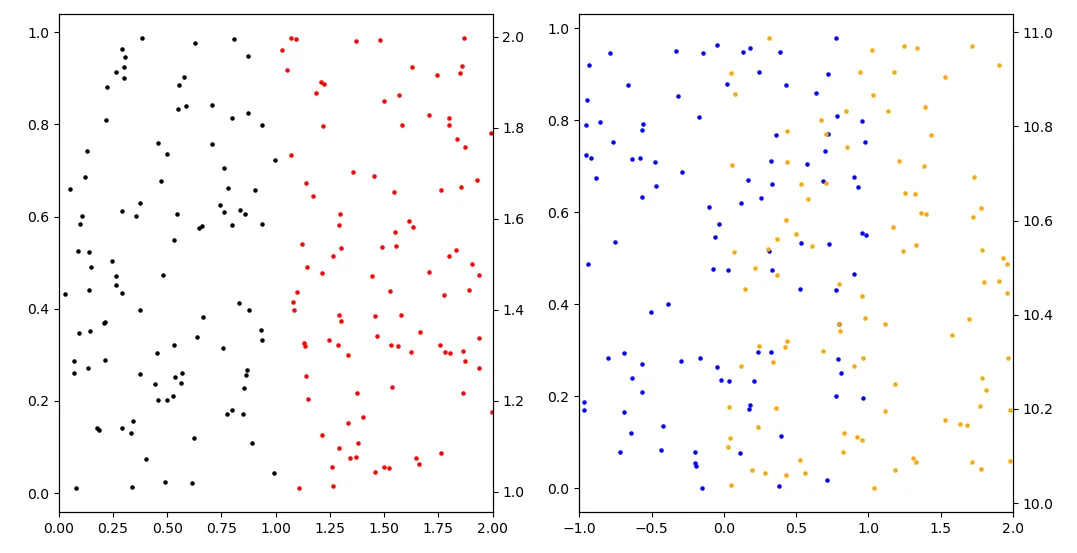
twinx()方法在一个坐标系对象上显示具有不同刻度的图形,参考Plots with different scales。 - david